Methods Template

Kourtney Burger

Title Page

This template can be used to create slides for your analysis methods

Edit the text and link in the footer above to redirect to your main methods page

See Quarto’s Revealjs documentation and options pages for more information on formatting and editing your slides

For advanced formatting options see Quarto’s Advanced Reveal documentation

New Slide

New slides can be created using the header options

  • ‘## Slide Title’ creates a new slide

  • ‘# Slide Title’ creates a new section with a title slide

  • See following slides for example

New Section/Title Slide

New Slide in Section

The outline can be viewed by clicking the three lines in the bottom left corner in the rendered slides

Formatting options

Multiple Columns

You can add text and images side by side using columns

Edit the number of columns and column width as needed

Left column

  • Text

Right column

Absolute Positions

Position images or other elements at precise locations using class .absolute

Content Overflow

Here are some ways to deal with too much information on one slide

  • Use the .smaller class to use a smaller typeface

  • Use the .scrollable class to make off-slide content available by scrolling

Content Overflow: .smaller

Here’s the smaller font

Content Overflow: .scrollable

Here you can scroll down the slide

  • List a

  • List b

  • List c

  • List d

  • List e

  • List f

  • List g

  • List h

  • List i

  • List j

Adding Code To Slides

You can add code blocks and executable code to your slides. There are a wide variety of options to customize and display code, see the following resources for guidance

Example Method Slides

Text and Image Side by Side

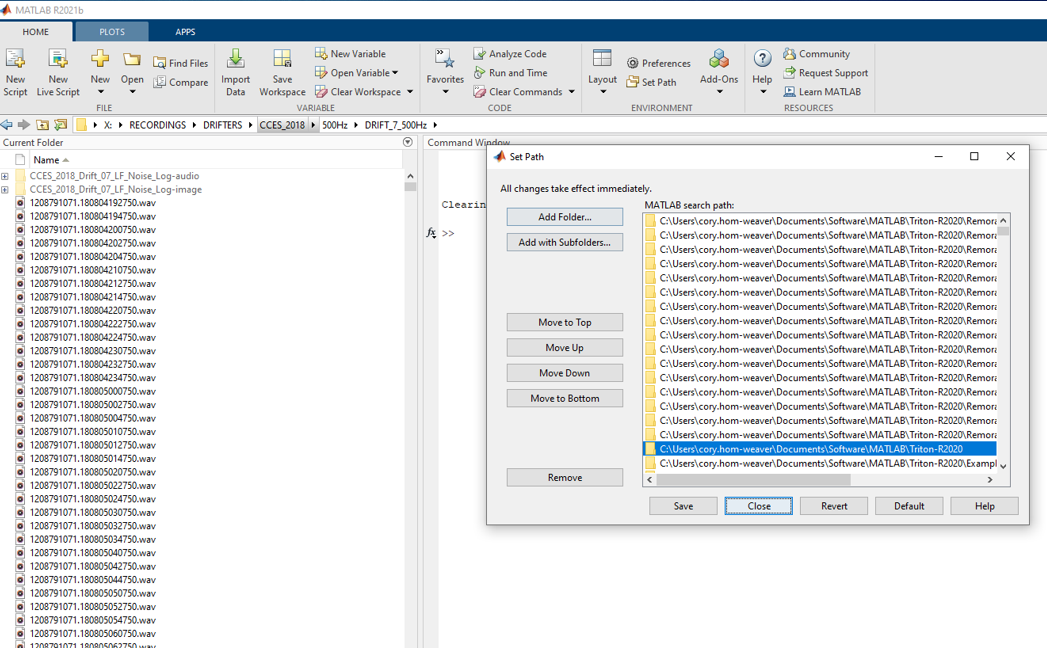
  • Currently we are using Matlab 2021b

  • On the home tab -> Environment -> Set Path

  • Click “Add folder with Subfolders…”

  • Browse to the folder containing Triton-R2020 (or the newest version of Triton on GitHub)

  • Click ‘Save’ and then ’Close

Slide with Multiple Columns

  • Start Matlab and at the command prompt type ‘triton’ and press enter to run the application

  • Three windows will be displayed:

    • Plot

    • Control

    • Message

Control Window - Controls settings for Plot Window

Message Window - Keeps a record of the users actions and displays Plot Window cursor location

Plot Window - Displays Long Term Spectral Average (LTSA), spectrogram, spectra, and time series plots

Slide with Scrollable Figure Panel

SNR 1 Call

SNR 2 Call

SNR 3 Call

Bad Recordings

Slide with Code

library(ggplot2)
ggplot(mtcars, aes(hp, mpg, color = am)) +
  geom_point() +
  geom_smooth(formula = y ~ x, method = "loess")

Slide with Executable Code

#library(ggplot2)
#ggplot(mtcars, aes(hp, mpg, color = am)) +
#  geom_point() +
#  geom_smooth(formula = y ~ x, method = "loess")

Slide with Highlighted Code Lines

library(ggplot2)
ggplot(mtcars, aes(hp, mpg, color = am)) +
  geom_point() +
  geom_smooth(formula = y ~ x, method = "loess")