# PAMpal simple example
# install.packages('PAMpal')
# updated 22-12-6 to include loop for PG event adding w/PAMmisc
# UPDATE 2023-09-06:
#   Changed first processing from mode='recording' because there were
#   DST-related bugs on some drifts. Lines 45-48 updated.

rm(list=ls())
devtools::install_github('TaikiSan21/PAMpal')
devtools::install_github('TaikiSan21/PAMmisc')
library(PAMpal)
library(PAMmisc)

# Start by creating a "PAMpalSettings" object. This keeps track of what data
# you want to process and what processing you want to apply to it.

# Change paths below to your DB and binary folder. Can just be the
# highest level binary folder for that drift - it will add all files
# within that folder recursively through subfolders.

# This will also ask you to type in some parameters for calculations
# in your console. You can just hit ENTER to accept defaults for all
# of these, they aren't relevant to the GPL calculations only for clicks.

pps <- PAMpalSettings(db = 'H:/DATA/PAMGUARD_FIN_CLICK/AddFinEvent/ADRIFT_053_PG_2_02_02_FinClick.sqlite3',
                      binaries = 'H:/DATA/PAMGUARD_FIN_CLICK/FinClickDetector_Run/Binaries/ADRIFT_053',
                      # these parameters are only for the click detector - can ignore
                      sr_hz=200,
                      filterfrom_khz=0,
                      filterto_khz=NULL,
                      winLen_sec=1)

# Now tell it to process your data. Id is optional and serves no function,
# but can be useful to tell data apart at a later point in time. Here
# mode = 'recording' tells it how to organize your data. Most of the time
# we are working with data that have been marked manually into events,
# so PAMpal wants to organize things into events. mode='db' uses the events
# in the database, and only processes the detectoins you've marked out.
# In this case we just want to process everything, which is what
# mode='recording' does. It will group them into events by recording file.

# This might take some time

# to read in events after processing in order to get the tim
#data <- processPgDetections(pps, mode='db', id='Humpback007')
wavFolder <- 'H:/RECORDINGS/12kHz/ADRIFT_053_CENSOR_12kHz'
wavGroups <- PAMpal:::mapWavFolder(wavFolder)
wavGroups$id <- basename(wavGroups$file)
data <- processPgDetections(pps, mode='time', grouping=wavGroups, id='Fin_ADRIFT_53')
# data <- processPgDetections(pps, mode='recording', id='Fin_ADRIFT_53')

# And here's how you can get the detections information out of "data"
# as a dataframe. Time column is "UTC", other columns are stuff it
# measured.
clickDf <- getClickData(data)

# Now we can add the wav files to this data. You might get a warning about
# "startSample", its safe to ignore that.
data <- addRecordings(data, folder=wavFolder)

# that data is stored here as a dataframe. Has "start" & "end" as POSIXct and
# the fulle path to the file as "file"
wavDf <- files(data)$recordings
# add number of detections to this
nDets <- sapply(events(data), nDetections)
nDets <- data.frame(join=names(nDets), nDets=nDets)
wavDf$join <- basename(wavDf$file)
wavDf <- left_join(wavDf, nDets)
wavDf$join <- NULL
wavDf$nDets[is.na(wavDf$nDets)] <- 0

nfiles =round(nrow(wavDf)*.2)
randStart =sample(1:5,1)

wavDf=wavDf[round(seq(randStart, nrow(wavDf), length.out = nfiles)),]


# If we care about assigning some kind of initial label to these
# detections. Otherwise ignore.
data <- setSpecies(data, method='manual', value='fin_click')

# Add events from wavDf loop
for(e in 1:nrow(wavDf)) {
  thisEv <- data[[basename(wavDf$file[e])]]
  # this will get all detector types, if just one type is wanted can
  # be simplified to ex. uids <- unique(getGPLData(thisEv)$UID)
  uids <- unique(unlist(lapply(getDetectorData(thisEv), function(x) {
    if(is.null(x)) return(NULL)
    x$UID
  })))

  addPgEvent(db = files(thisEv)$db,
             binary = files(thisEv)$binaries,
             eventType = species(thisEv)$id,
             UIDs = uids,
             type = 'click',
             start = wavDf$start[e],
             end = wavDf$end[e],
             comment = paste0('Added by PAMpal, event ID: ', id(thisEv)))
}Semi-Automated Approach to Detecting 20Hz Fin Whale Pulses
Step 1: Open PAMGuard
- Open PAMgaurd and navigate to the settings file that has “FinClick” in the name
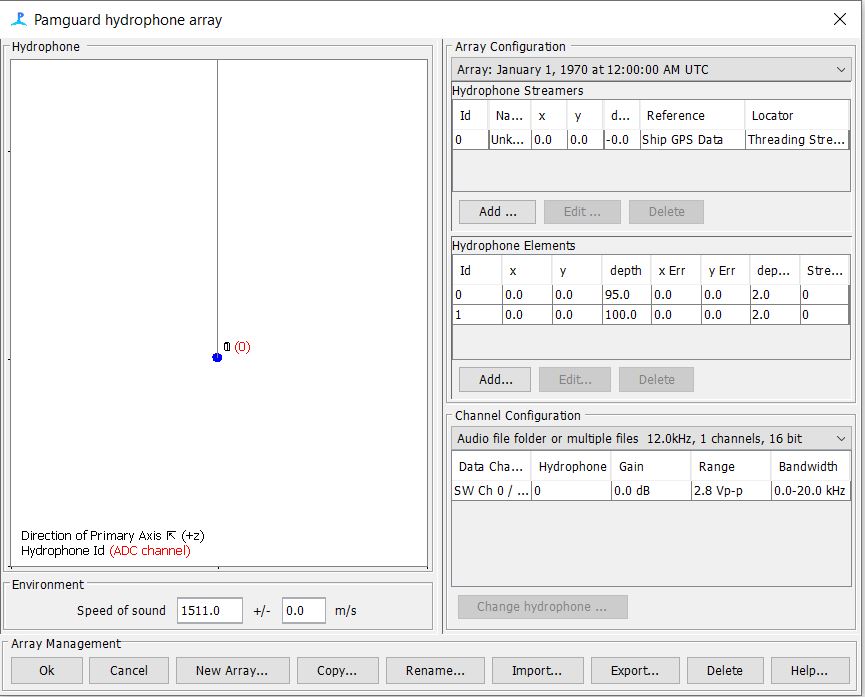
Step 3: Update the Array File
Open Hydrophone array settings
- Modify settings to match deployment details for the specific array used for your drift
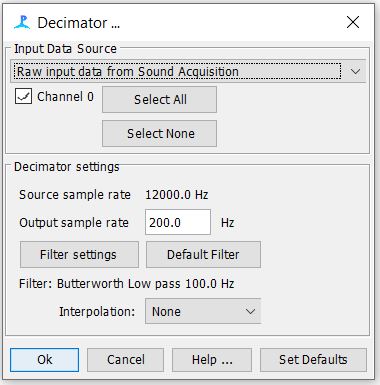
Step 4: Decimator Settings
- Check to see that your decimator settings match the settings below
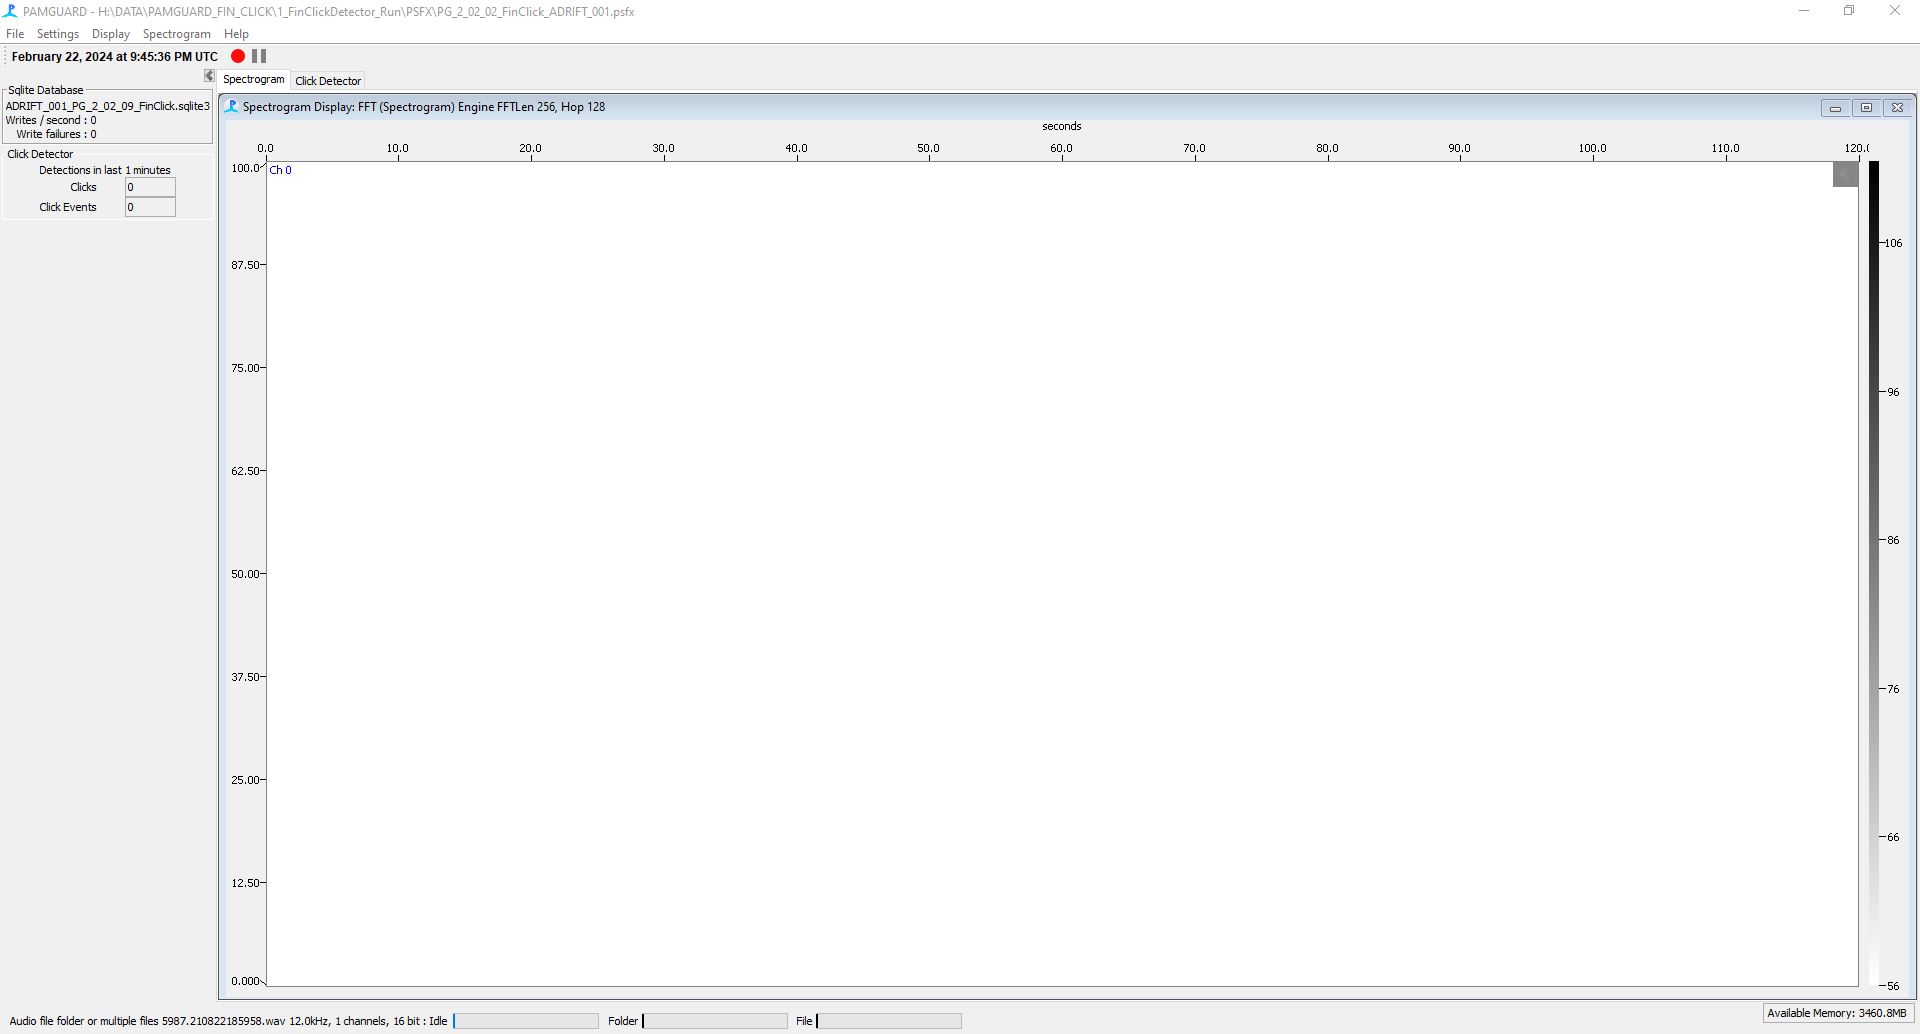
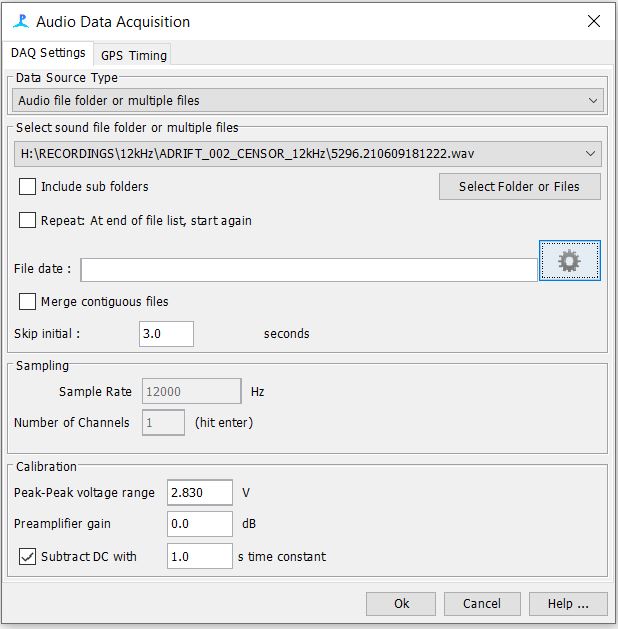
Step 5: Sound Acquisition
Navigate to your sound files
- We used 12kHz files, which were previously decimated in Triton Software
Due to an offset at the beginning of the SoundTrap wav files, we need to make sure to skip the initial 3 seconds of the recording
Your settings should look like the following below
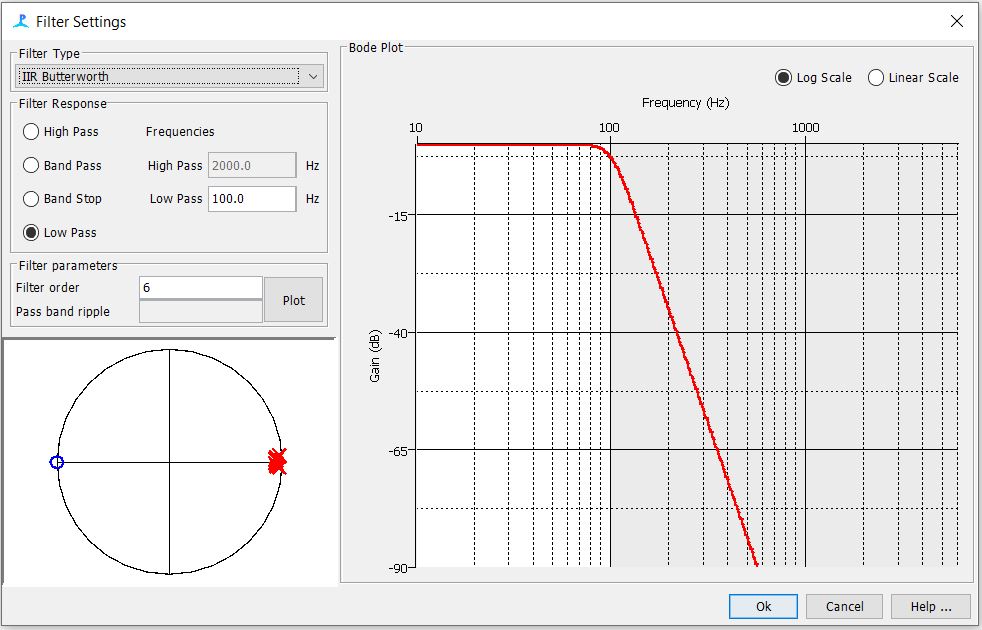
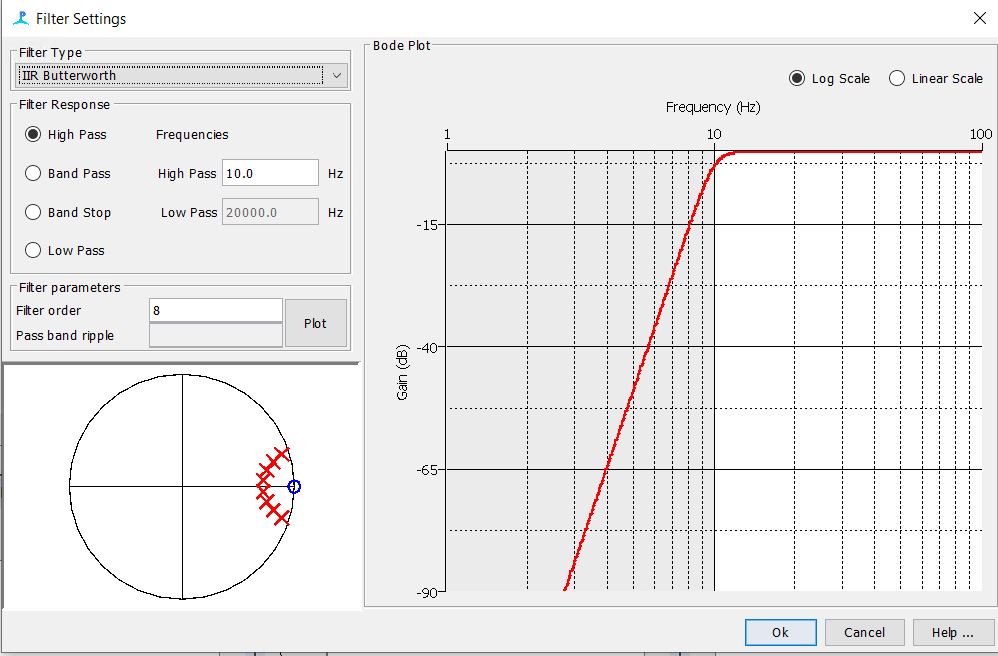
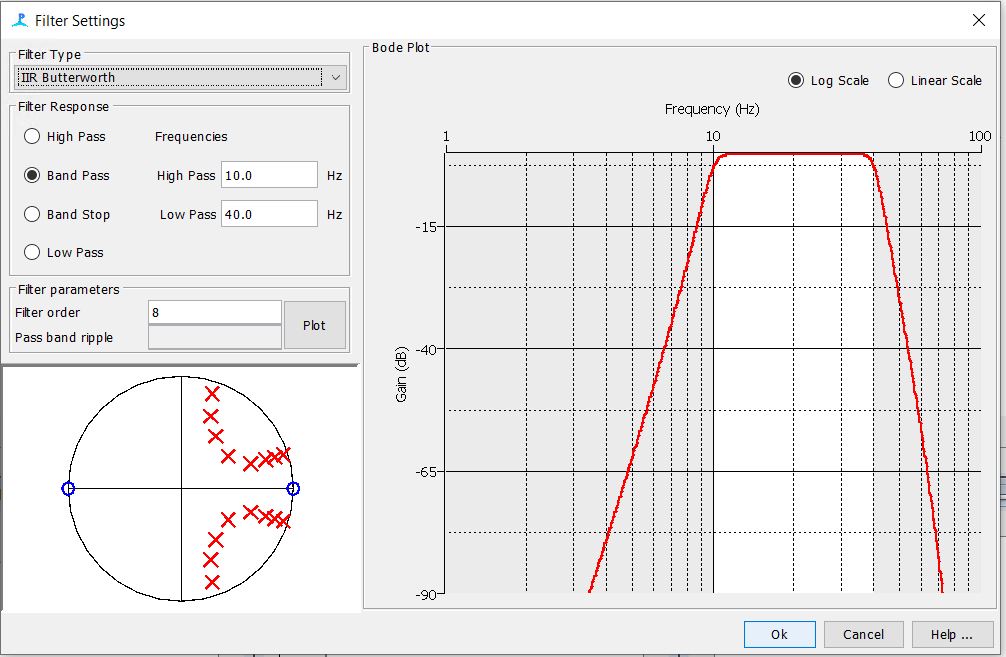
Step 6: Check the Digital Pre and Trigger filter Settings
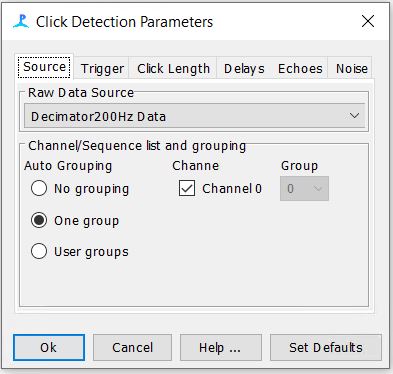
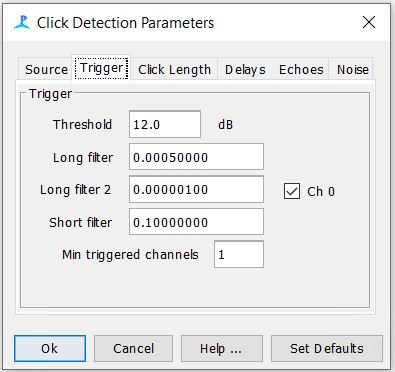
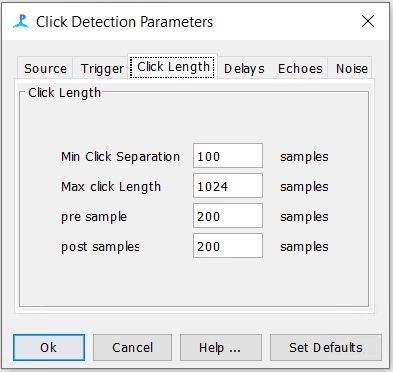
Step 7: Check the Click Detector Settings
-The settings for the first three tabs should be as follows. The rest of the tabs can be left to their default
Step 8: Process each Drift
Click the play button and let your wav files run through PAMGuard
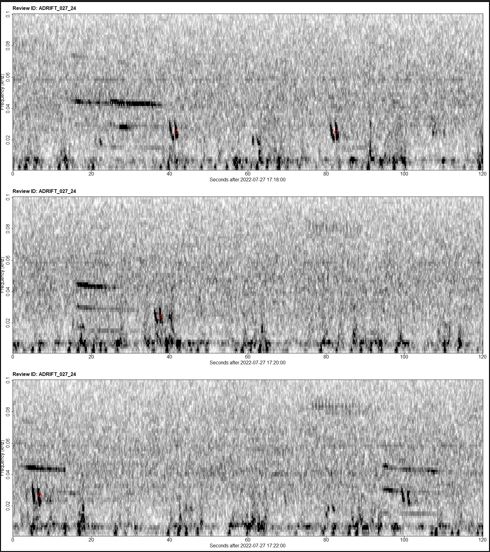
- 20Hz Fin Pulses should have Wigner Plots that are down swept
- Peak frequency will be close to 20-25Hz with some variability
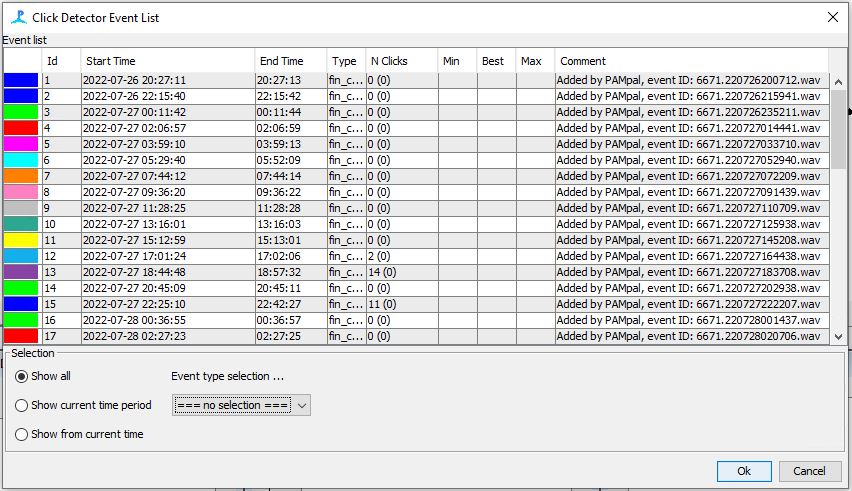
Step 10: Open the Database in Viewer Mode
Open the database that you have added events to with PAMGuard Viewer Mode
- Use the original binary files
Check to see that your events were added correctly under Click Detection–>Show events
Step 11: Add Spectrogram Annotation Moduel
Open the database that you have added events to with PAMGuard Viewer Mode
- Use the original binary files
Add the “Spectrogram Annotation Moduel”
Once added you should see “Spectrogram Annotation Settings” under the settings menu
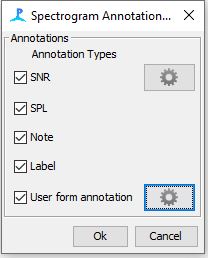
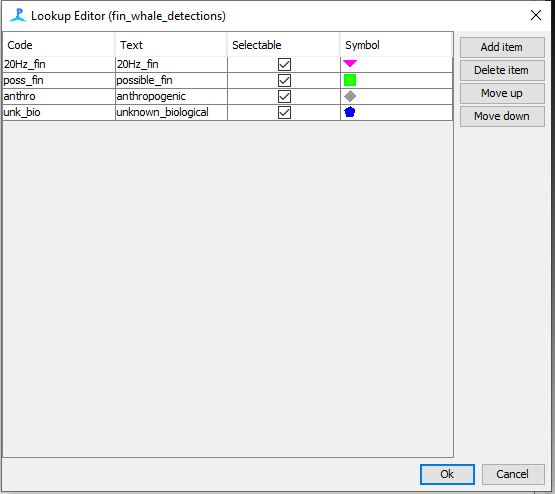
Step 12: Add LOOKUP Table
Click on the gear icon for the “User Form Annotation” check box
Click on “Create New”
A new dialog will pop up and under the left side you will Add a LOOKUP table
Fill in the metadata for the table as follows
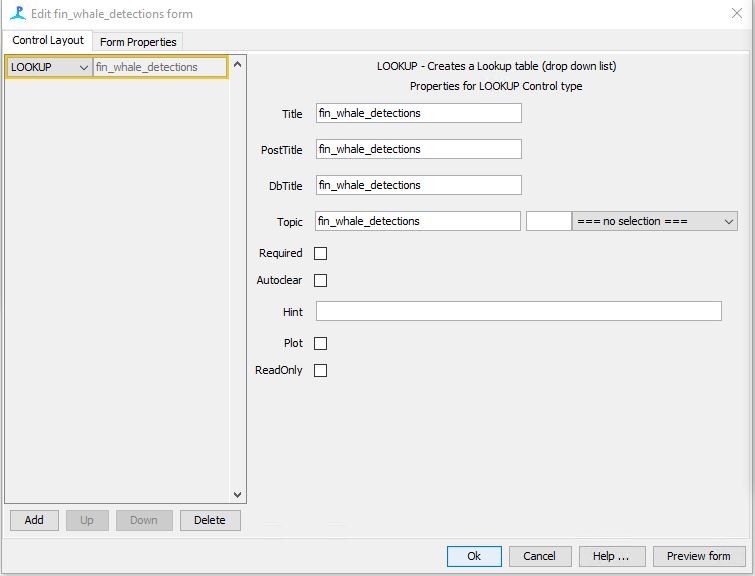
Step 13: Add drop down list for LOOKUP table
Right click on the drop down menu to the right of the Topic section
Click on edit list
- Add the following 4 options as seen in the image to the right
- Click ok on all of the promts
- In order for your settings to work you will need to save and restart PAMGaurd
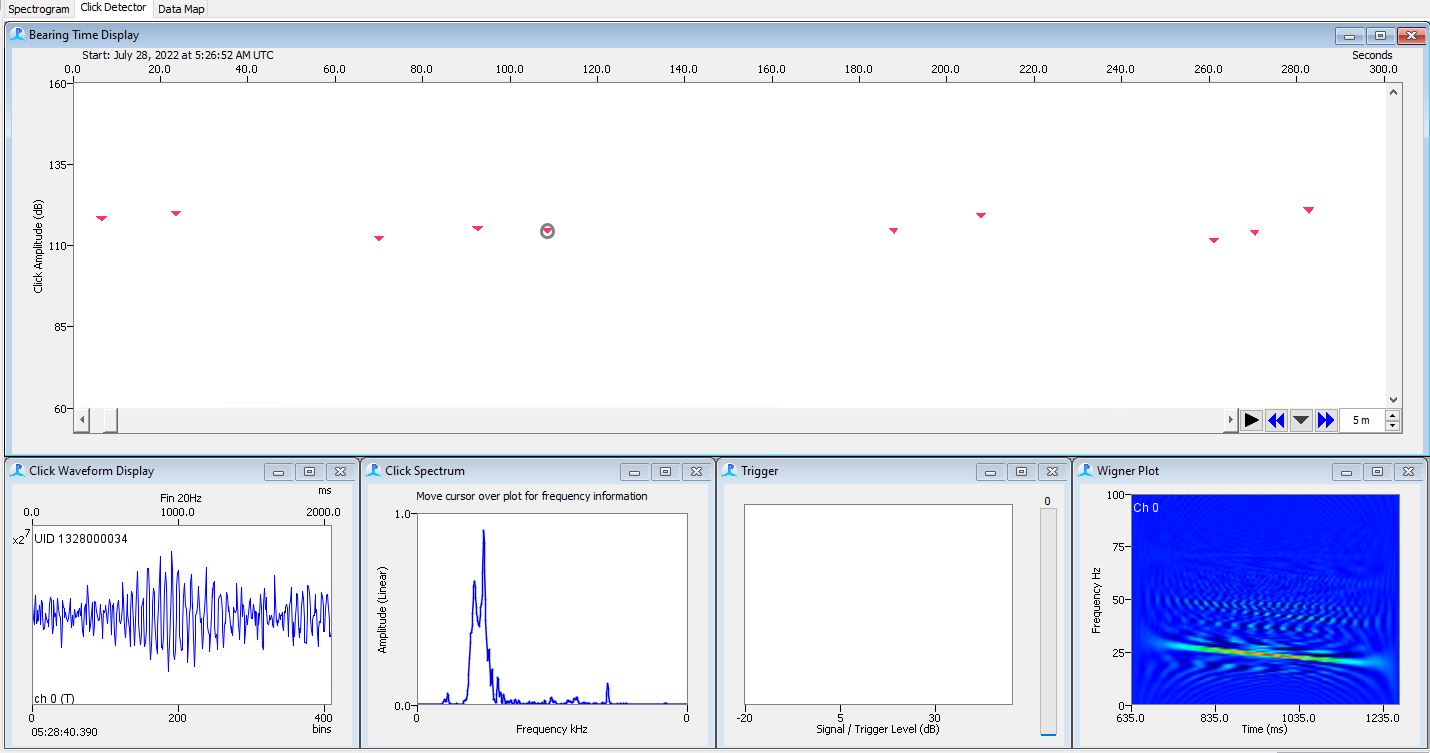
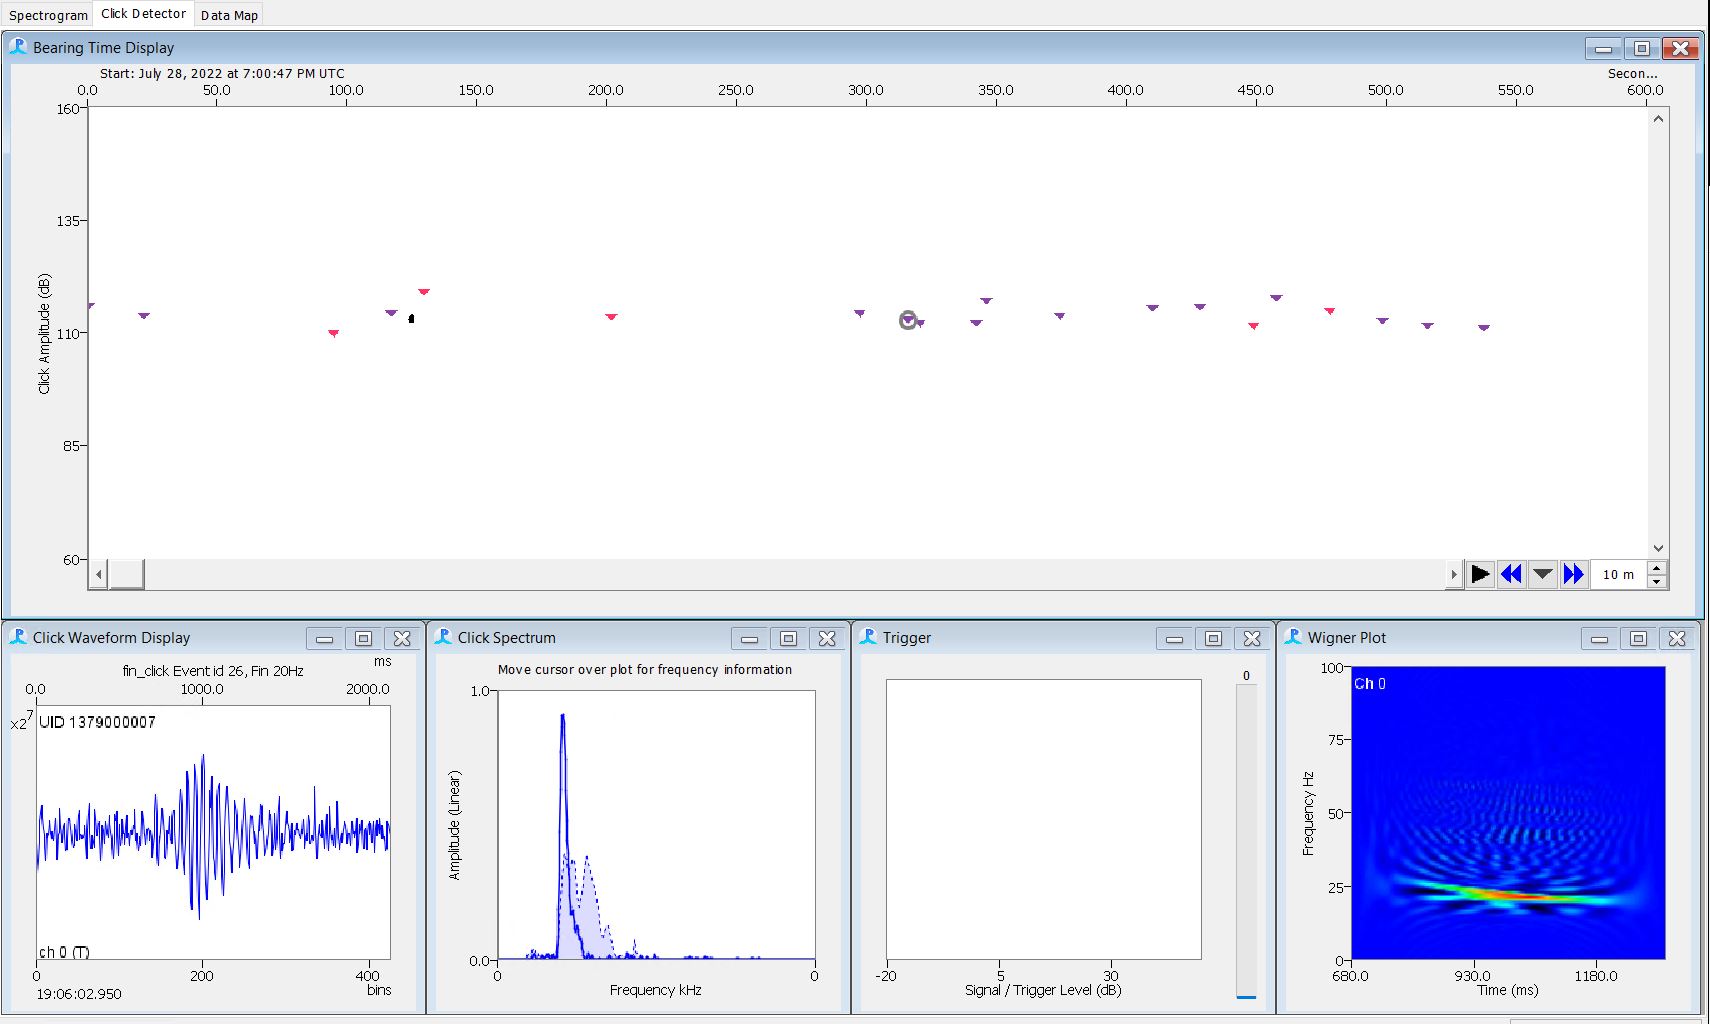
Step 15: Start Validating Events
- Use the Click Detector Event List to Navigate to each event
- Use the click detector to add or remove clicks to an event
- Use the Wigner and the click spectrum to determine if the click is a 20Hz fin pulse
- Look at the spectrogram and see if the click looks like a 20Hz fin pulse
- Use the click detector to add or remove clicks to an event
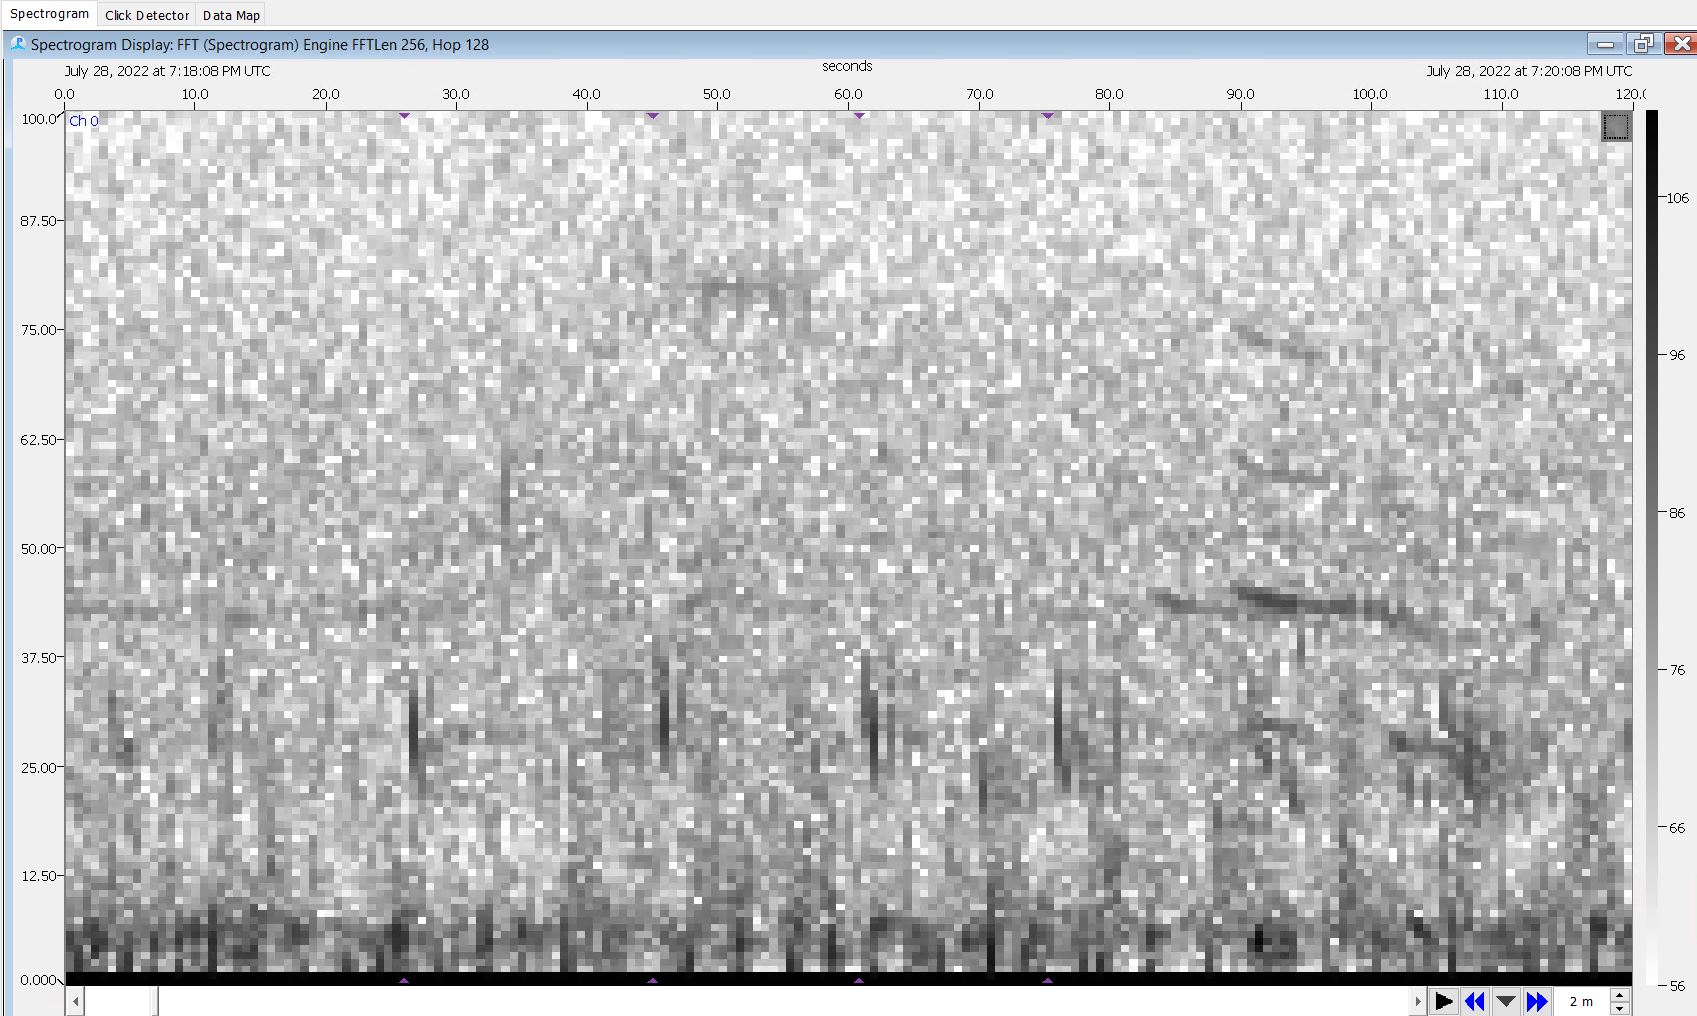
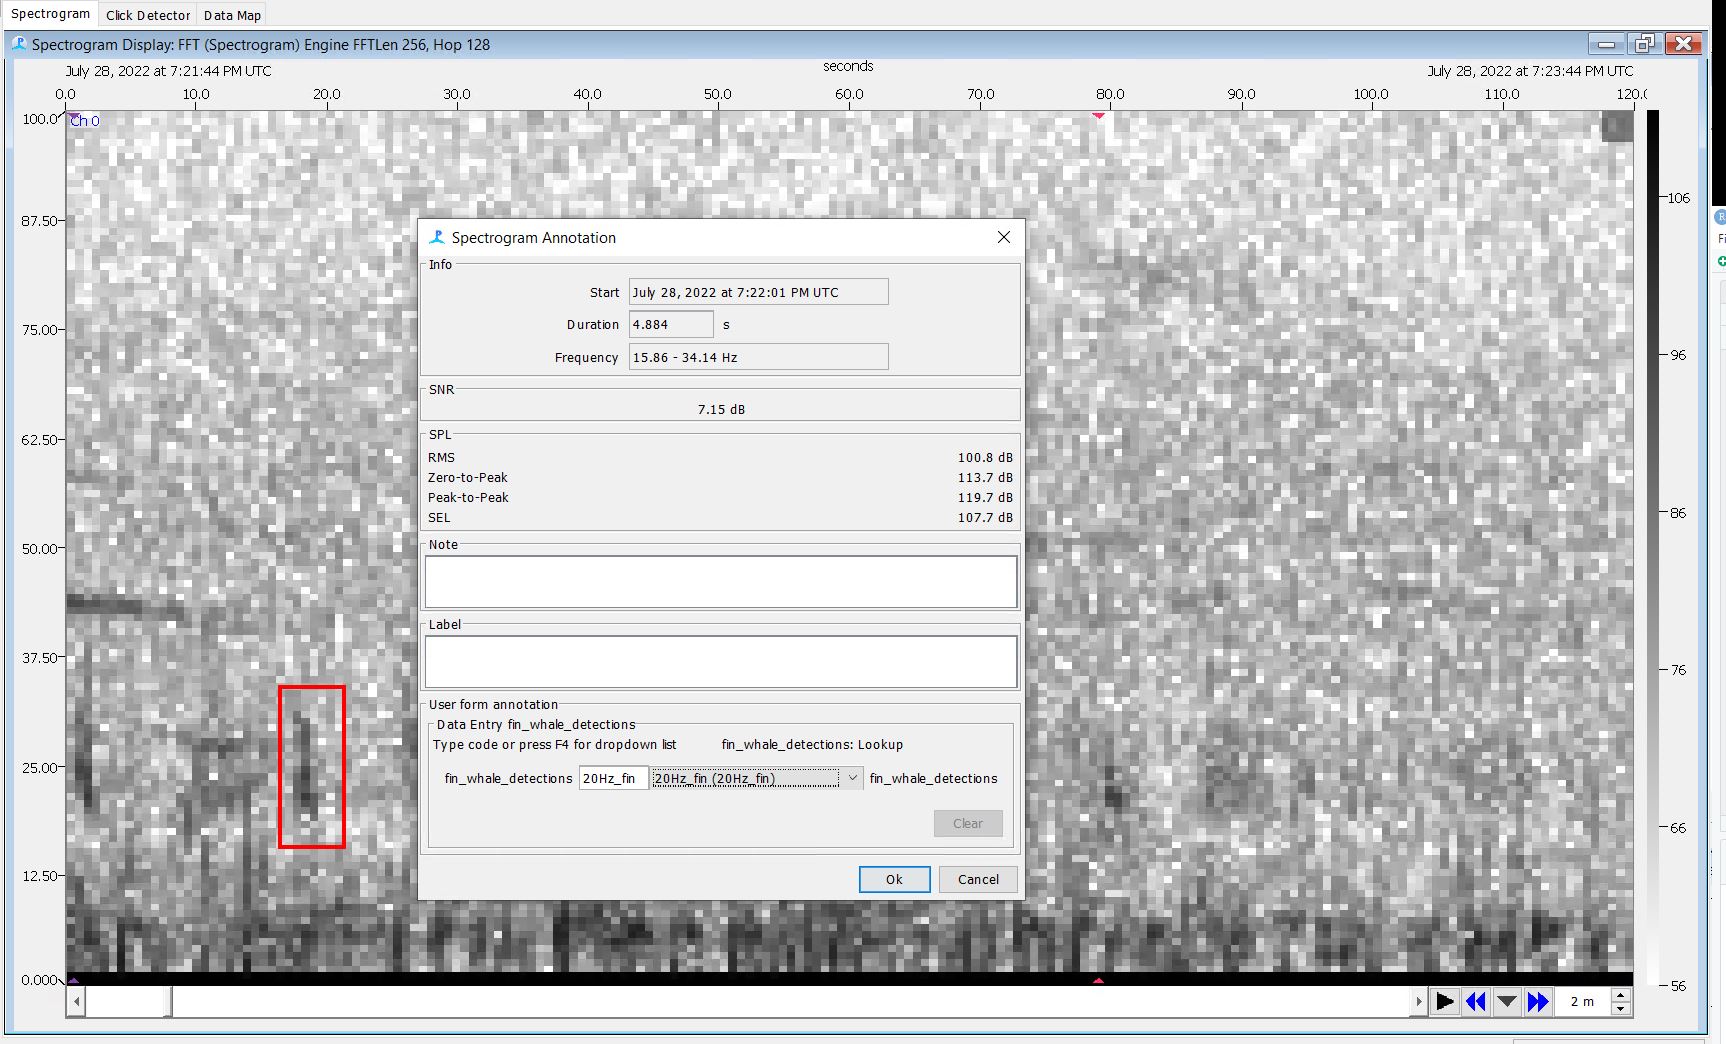
Step 16: Annotate Missed Fin Pulses on the Spectrogram Display
- Scroll through each event using the spectrogram display
- Annotate any 20Hz pulse that was missed by the click detector
- Draw a box around the click and use the drop down menu to select the sound you’re boxing
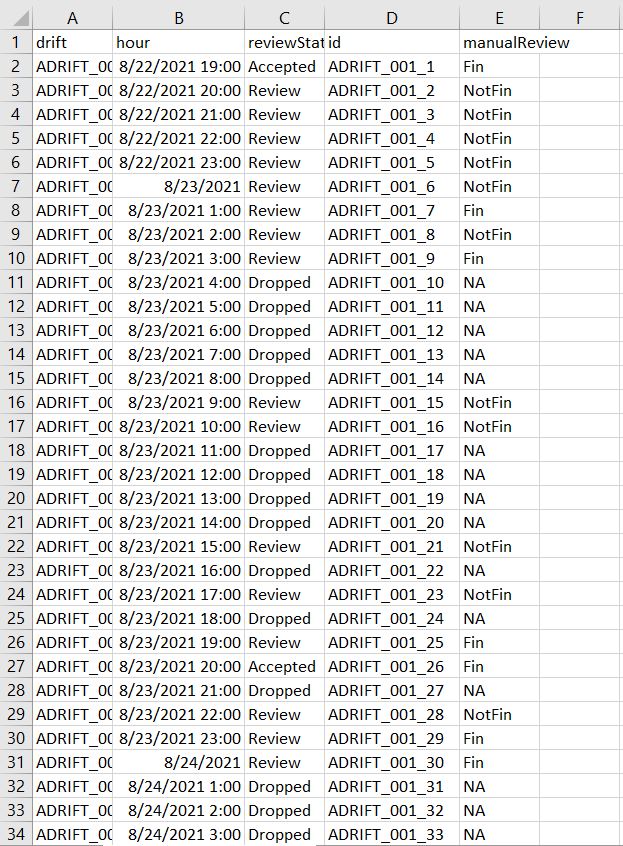
Step 19: Validate Predictions
- Using Taiki’s finProcessReivewScript.R we can quickly review all “Accepted” and “Review” hours.
- We would track our progress using a “.CSV”. Under the manualReivew column we entered Fin or NotFin for that hour based off of the spectrogram images.