Methods for Logging Baleen Whales SWFSC
Step 1: Open Matlab and Set the Path
Currently we are using Matlab 2023a
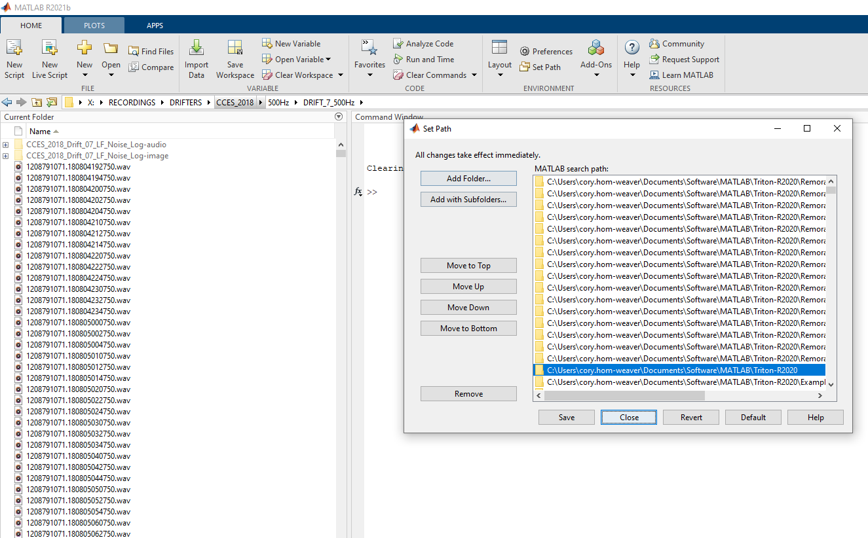
Click on the home tab ->Environment->Set Path
Click “Add folder with Subfolders…”
Browse to the folder containing Triton-R2020
Click “Save” and then “Close
Step 2: Open Triton
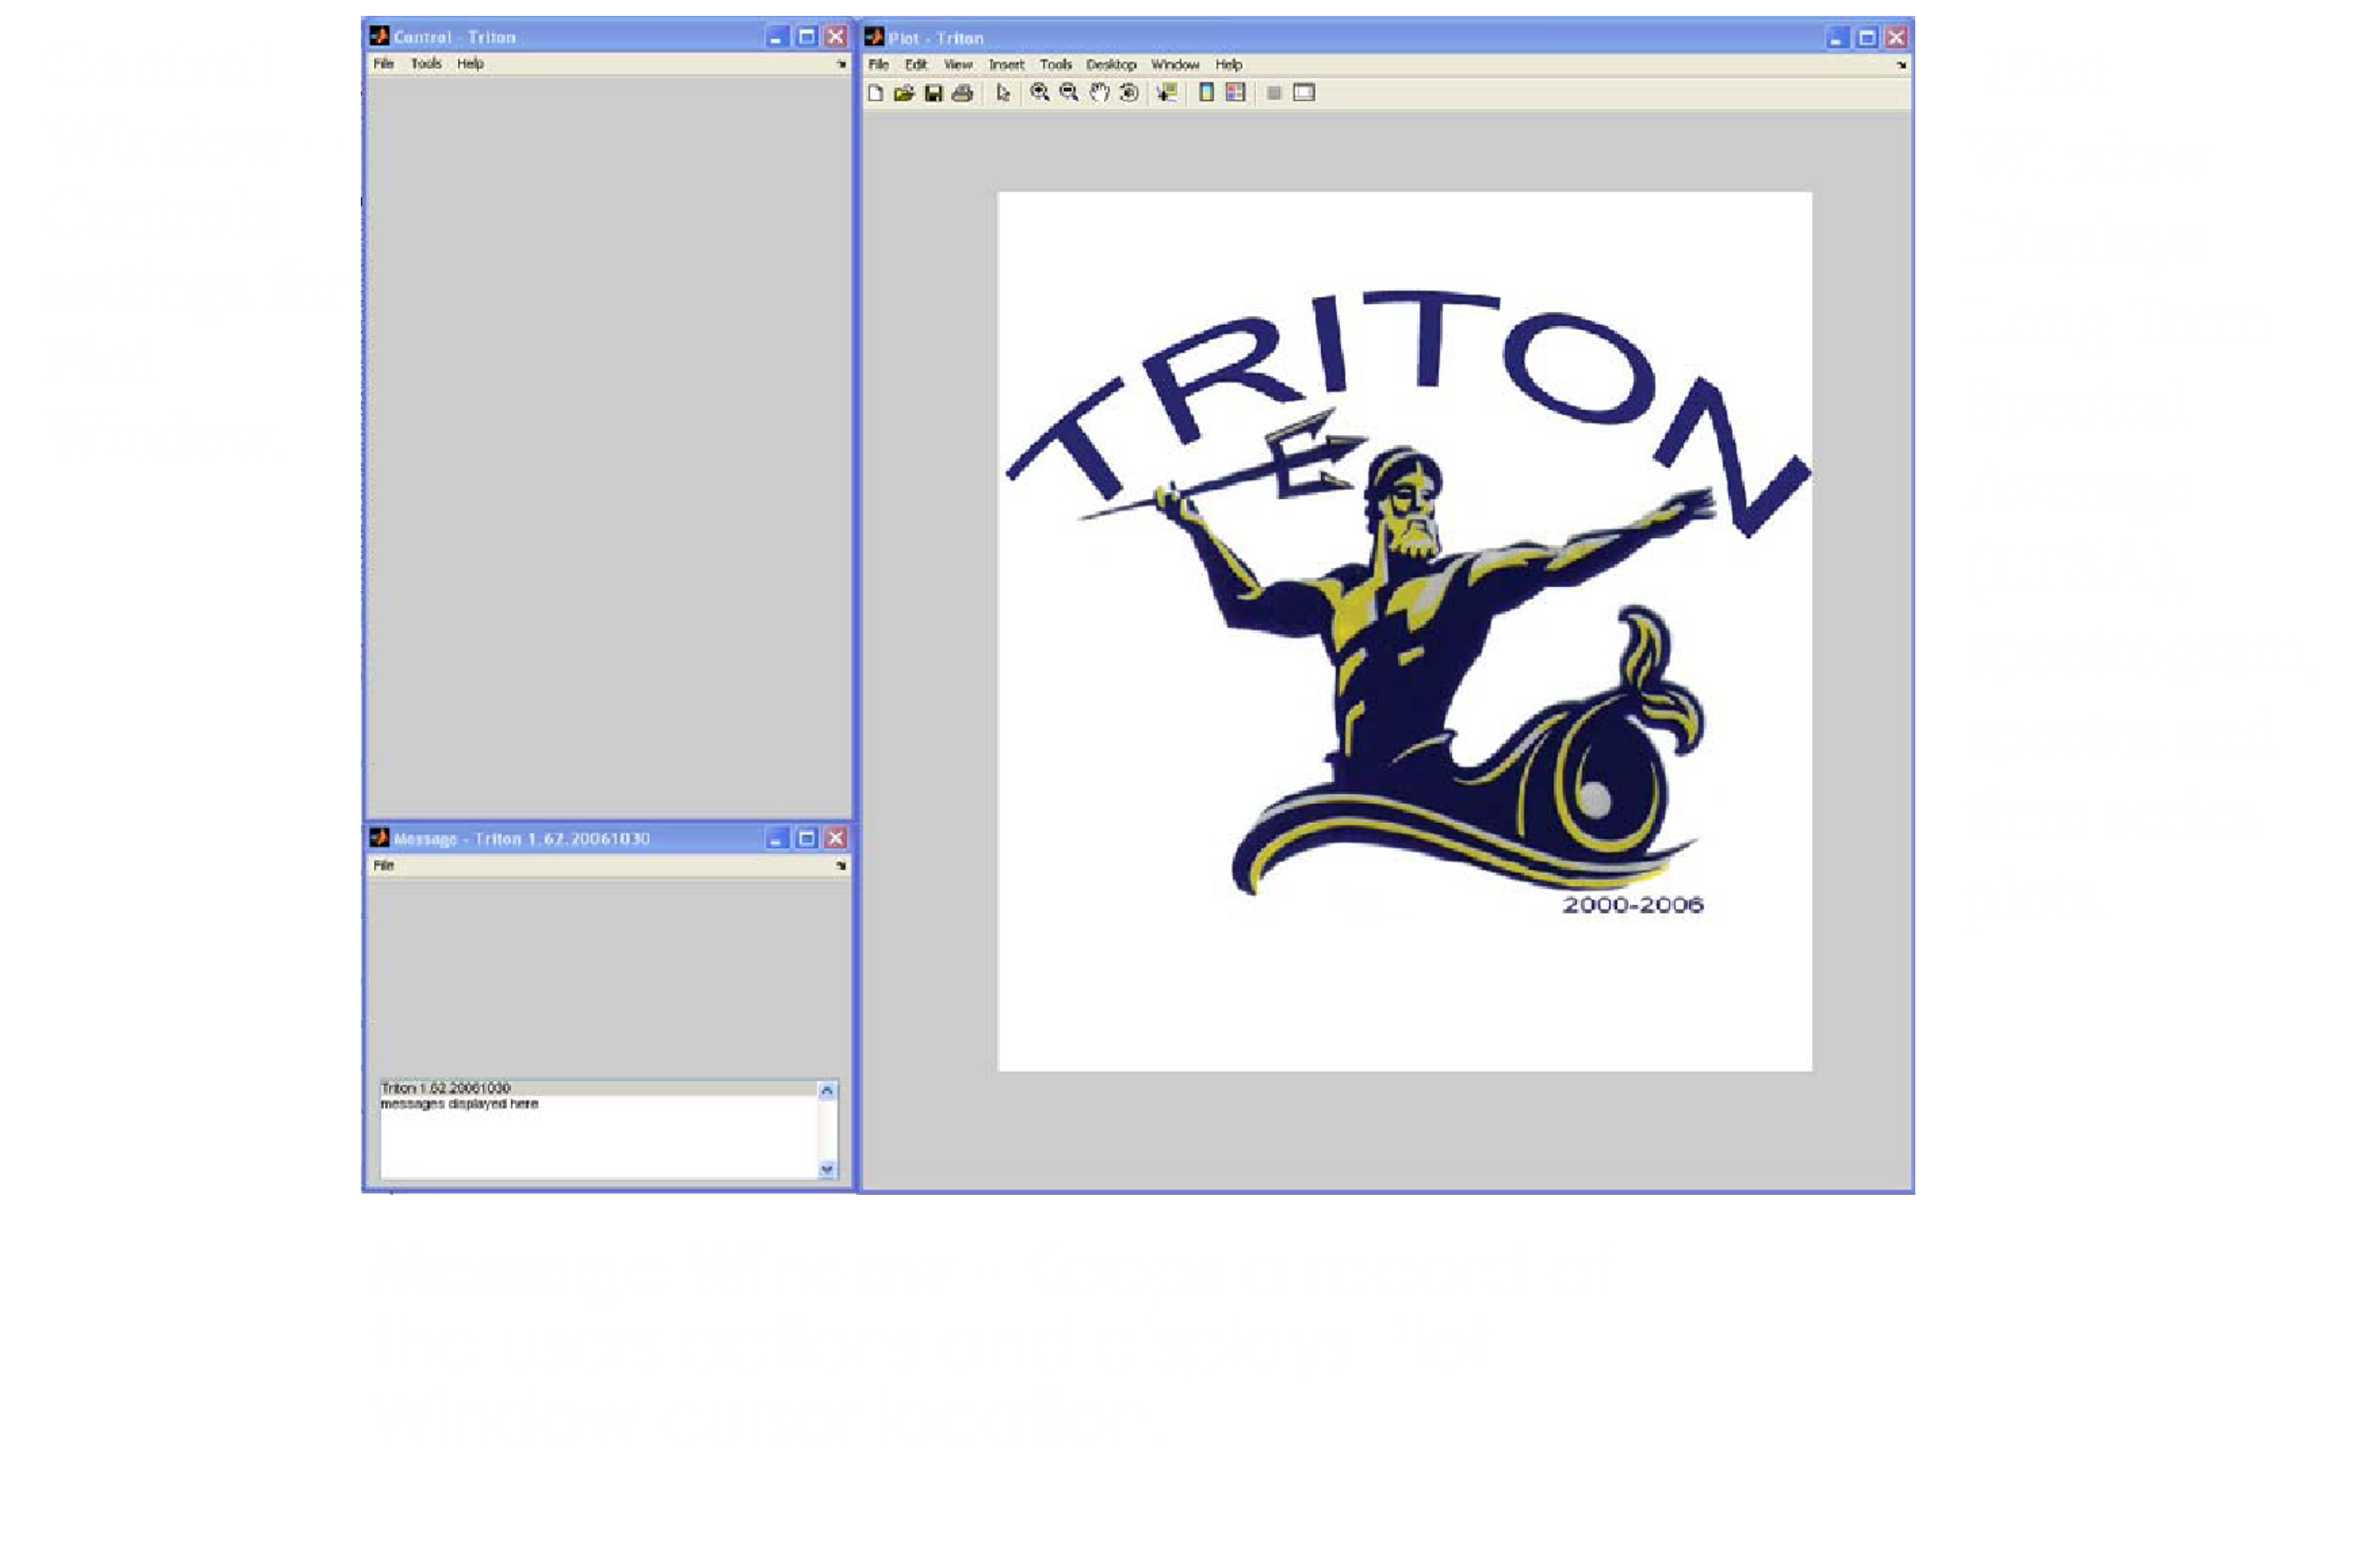
Start Matlab and at the command prompt type ‘triton’ and press enter to run the application
Three windows will be displayed: Plot, Control, & Message…
Step 3: Add Logger Remora
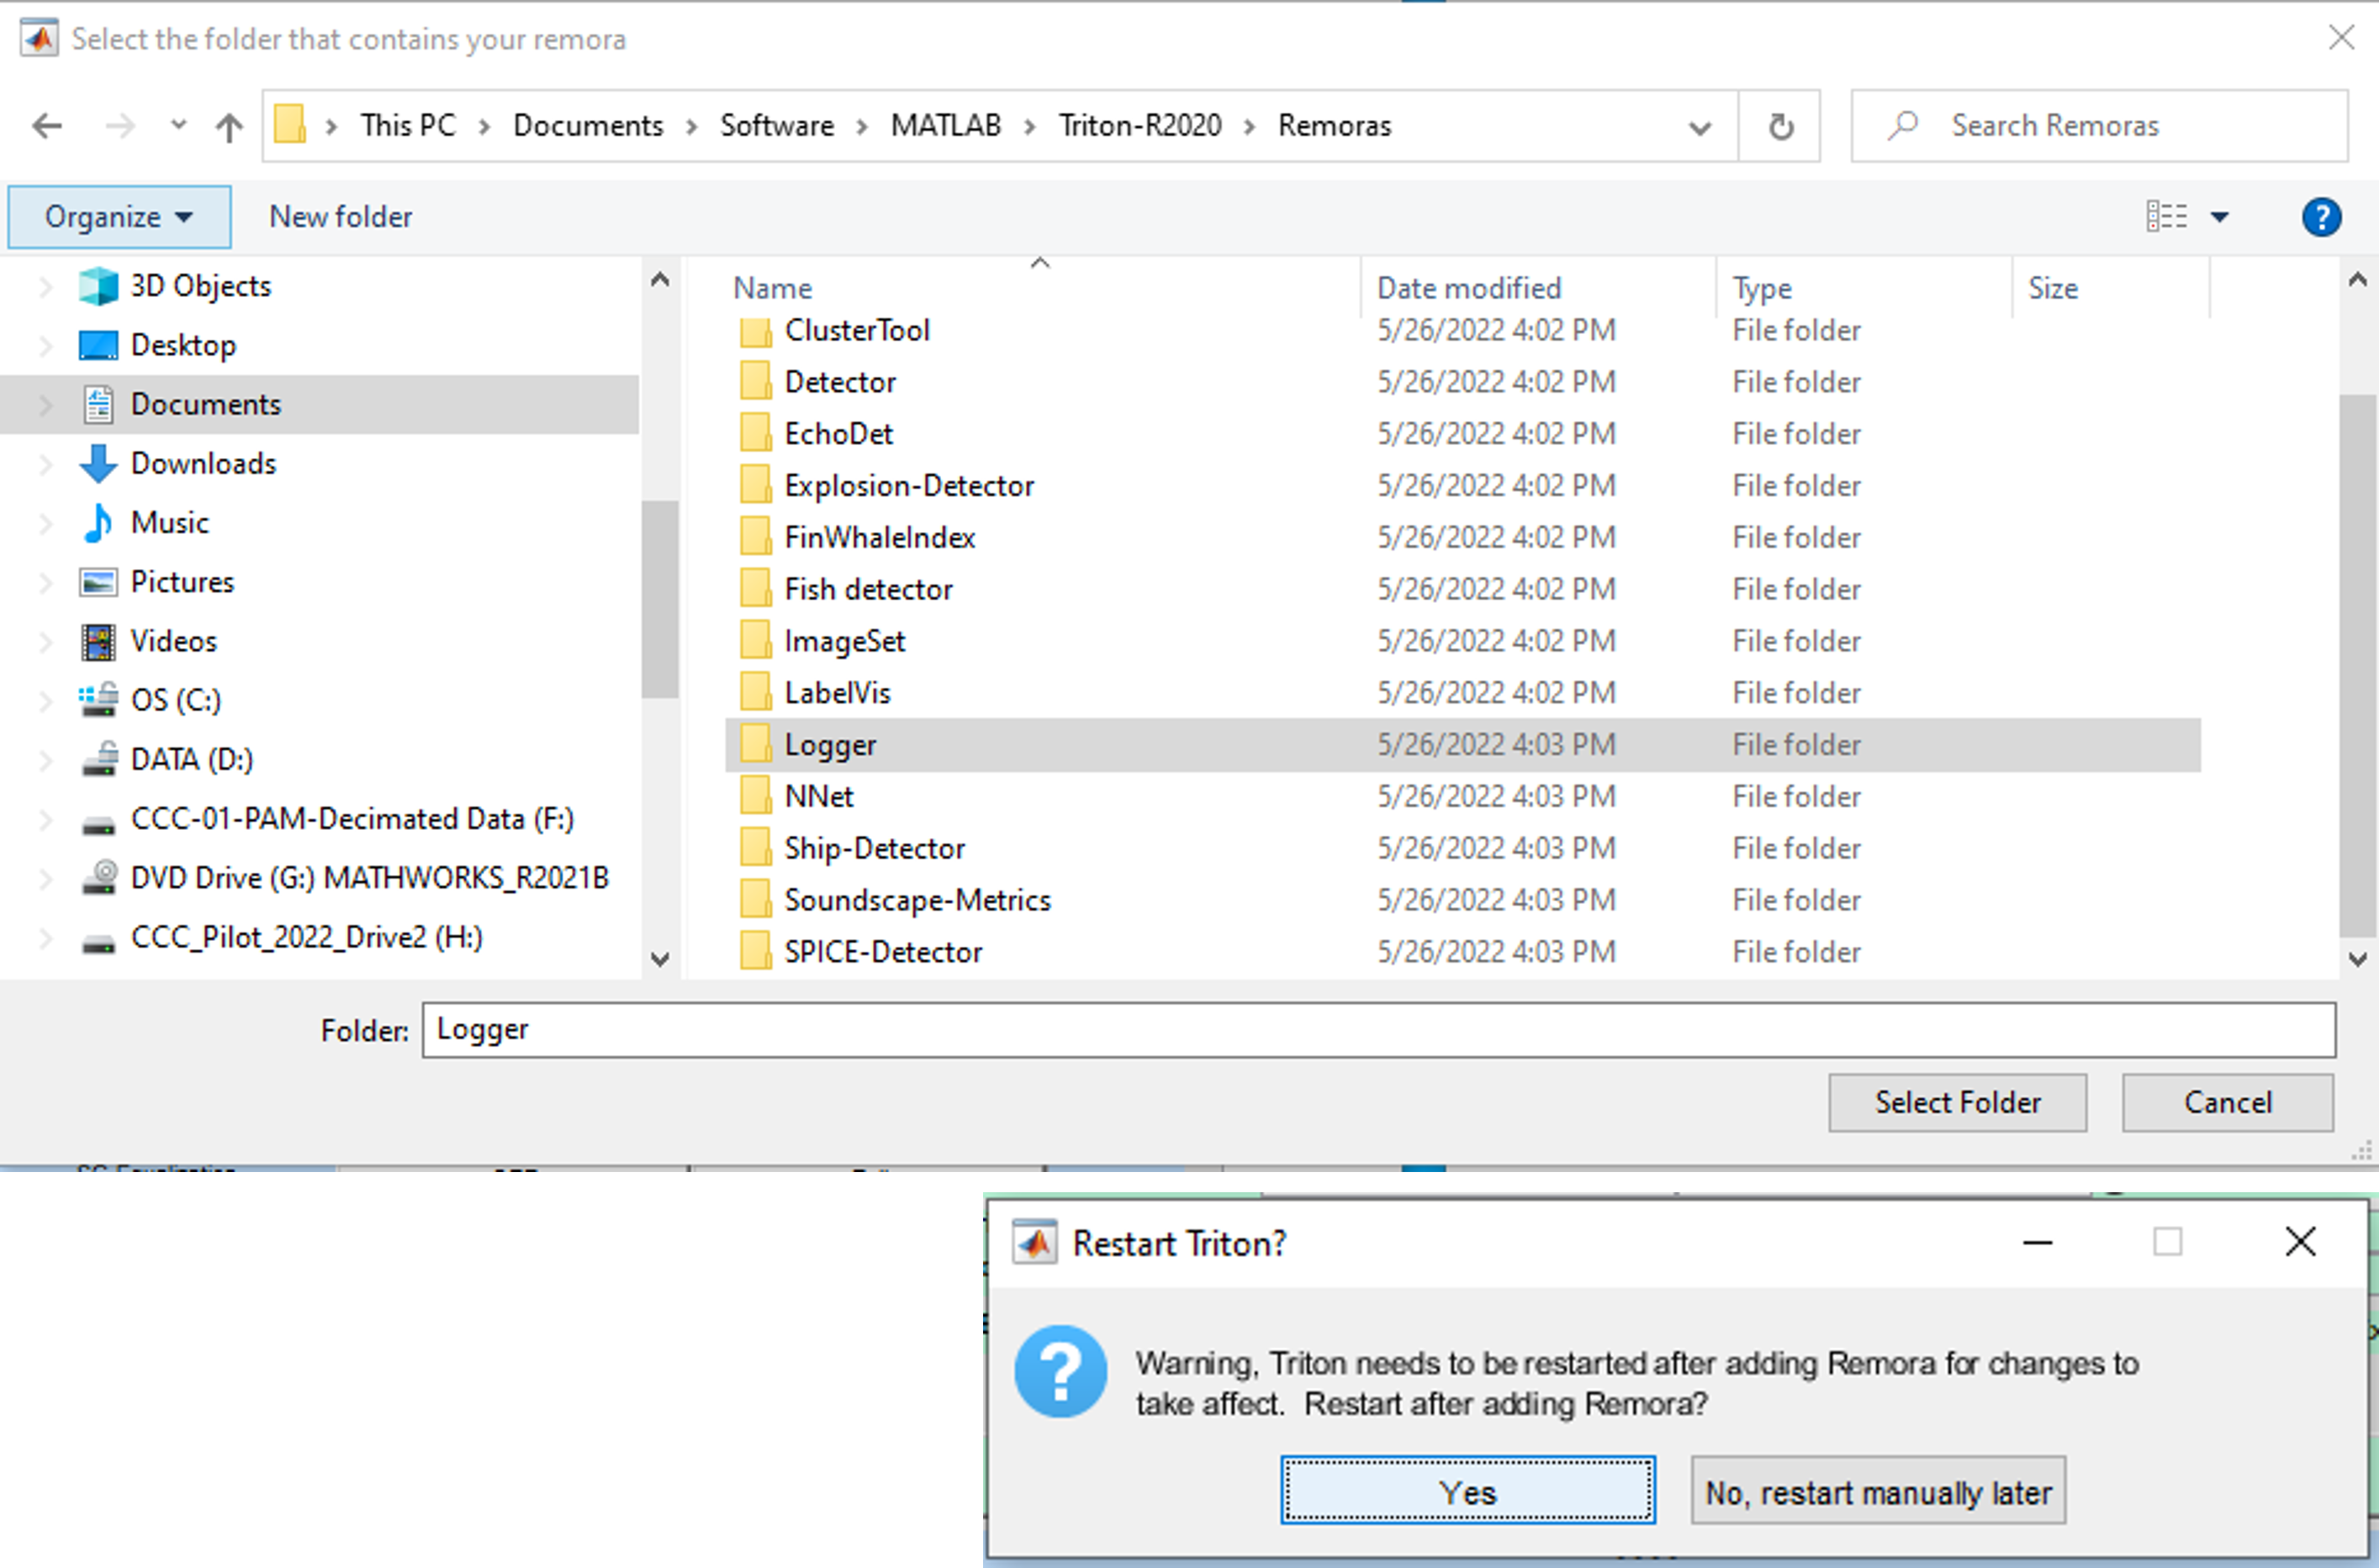
In the control window (upper left hand window) click on ‘Remoras’ then ’Add Remora.”
Browse to the folder containing Triton->Remoras->Logger. Highlight this folder and click ‘Select Folder’
A new window pop up asking to restart Triton, click ‘Yes’
You will only need to add the Remora once. Triton should remember this once you have added it. It will prompt you to restart Triton at this time.
Step 4: Open an LTSA
Click File->Open LTSA
Browse to the LTSA you wish to use for your log (they may vary depending on the species you are logging). Blue and Fin whales were logged using 500Hz LTSAs
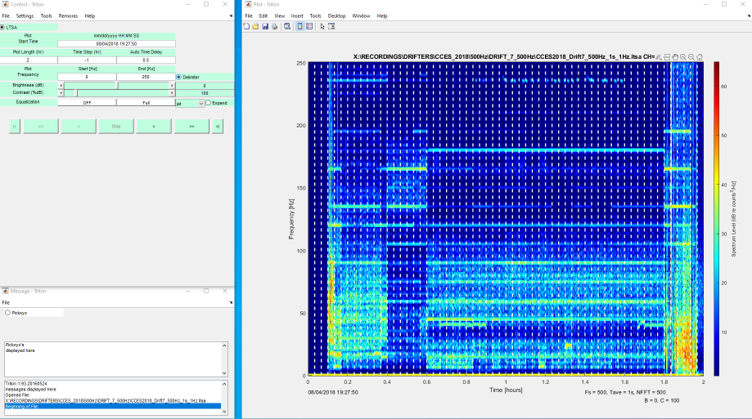
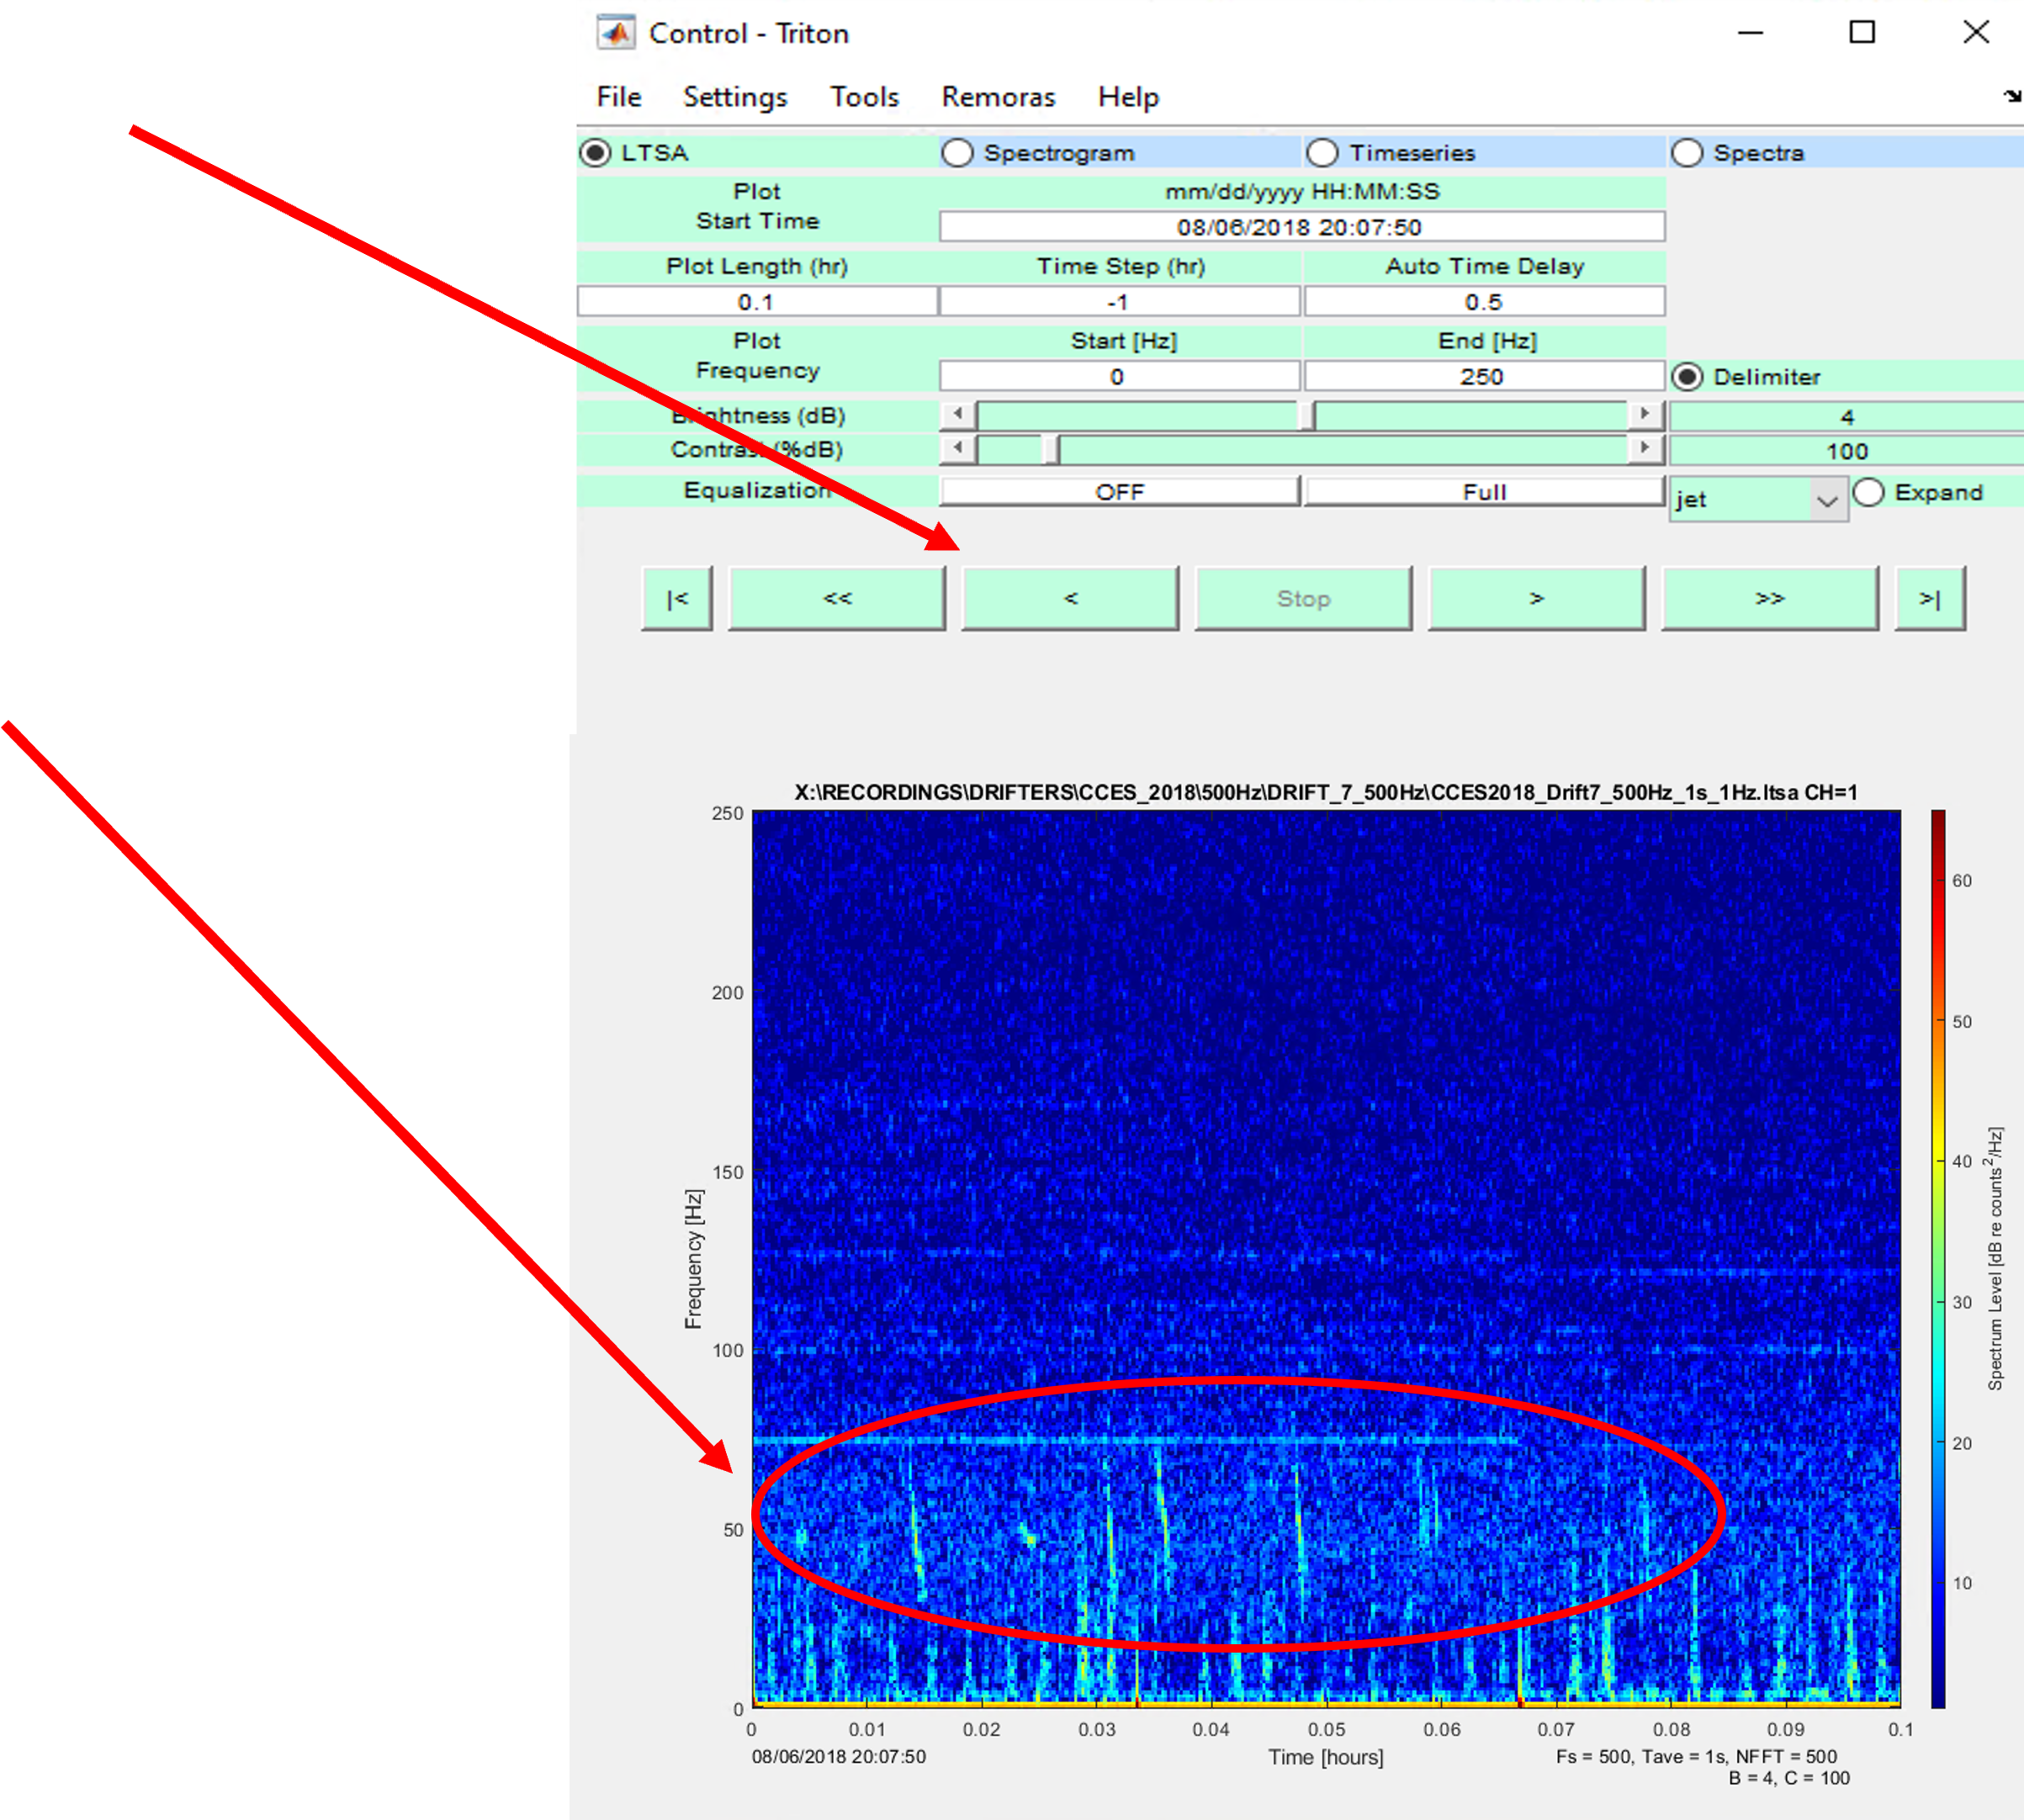
When it opens the plot and control windows may look something like this
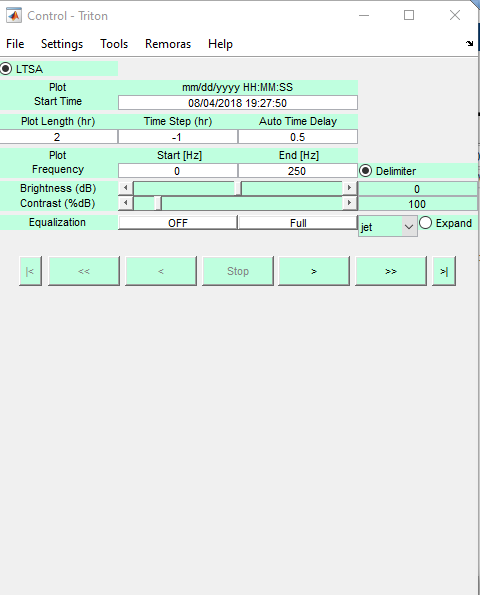
Step 5: Set Parameters
If you are logging duty cycled data you will want to be looking at around 1 hour at a time. Set the plot length accordingly.
If you are logging continuous data then plot length should be 1
Make sure you start logging as close to the start of the hour as possible
Brightness should be from 0-10dB
Contrast should be around 100dB
Depending on the species you will want to adjust your upper frequency bounds.
- For blue and fin whales you can look at 0-150Hz
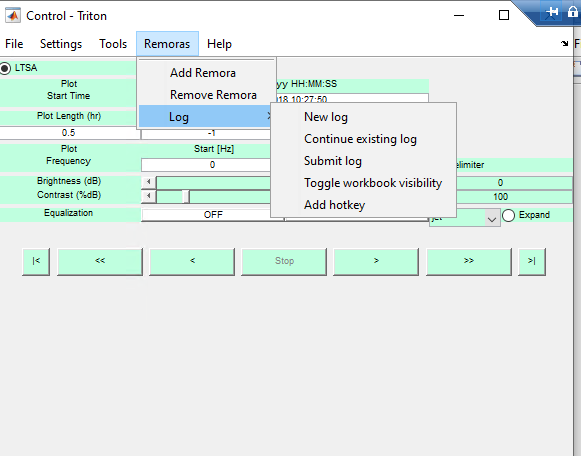
Step 6: Create a New Log
Click on Remoras->Log->New Log
Enter in the name of the log and direct Triton to save it in the folder with the LTSA
Name your log with the Cruise_Year_Drift_#_Species_Log
- Ex: CCES_2018_Drift_07_BlueWhale_Log
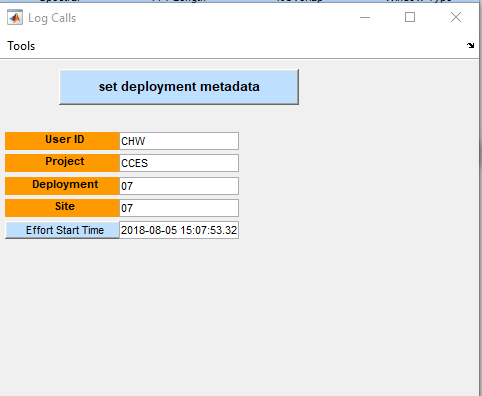
Step 7: Set the deployment metadata
Type your initials in the ‘User ID’ tab
Type the project name in the ‘Project’ tab
Type in the Drift number in “Deployment’ and ‘Site’ tabs
Then select your start time on the LTSA.
- Remember to make sure to start as close to the hour as possible
- Click ‘Set deployment metadata’
Step 8: Setting up logging options
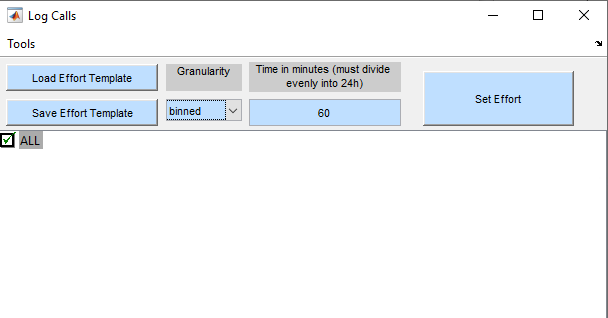
Check ‘All’ under the logging options
- You can double click the “All’ button to expand it and check off specific species if you want.
Under Granularity select ‘binned’
Under time in minutes type ’60
Click ‘Set Effort’
- NOTE: Although your log is open in the background do not make changes to it. If you need to make a change to your spreadsheet you must end your logging session and then open the spreadsheet to make changes.
Step 9: Scrolling and looking for calls
Use the arrows on the LTSA to scroll back and forward in time
Look for spikes of energy in the LTSA
- These are Blue whale D calls with low frequency noise
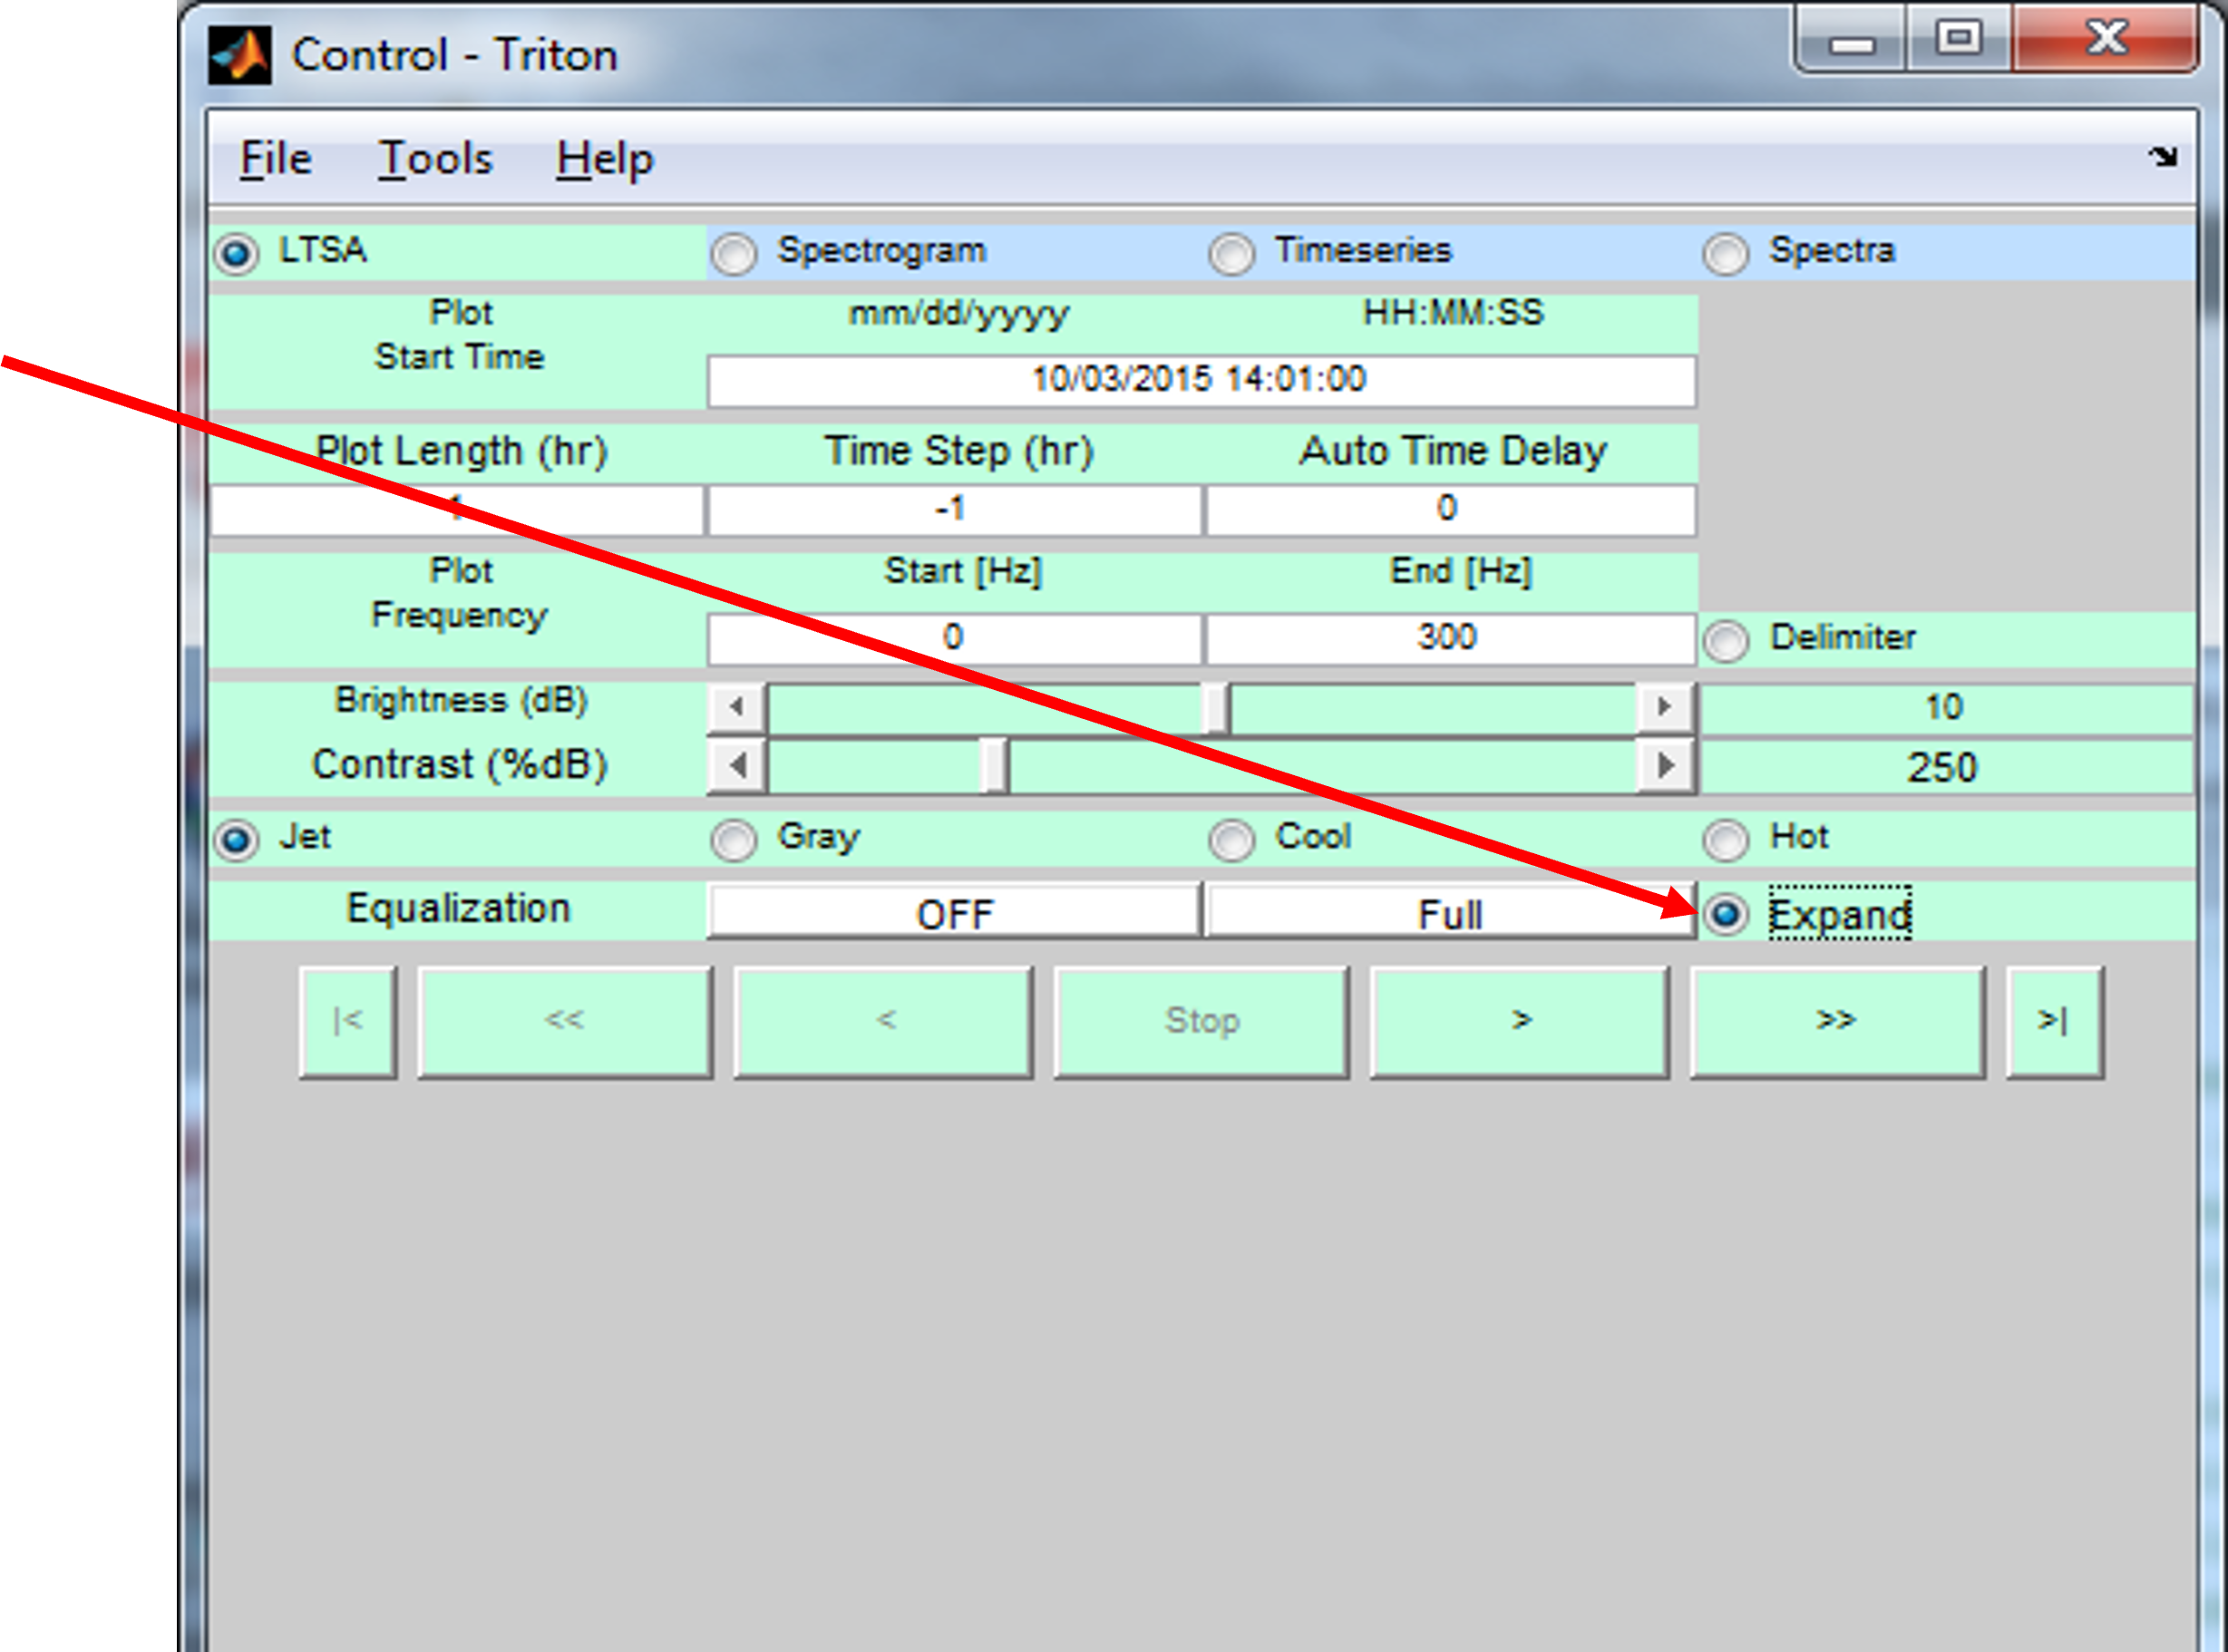
Step 10: Zooming in on a sound
When you see a spike of energy that you want to investigate click on the ‘Expand’ button to open the associated wav file
Then click on the part of the LTSA that you want to look at in more detail
Step 11: Adjust Spectrogram Parameters
Set the plot length to 120 s. If it wont let you set it that high then use the back arrow to scroll to the beginning of the wav file
Set the Plot Freq End to 200 Hz. We are looking for calls generally below 100 Hz.
FFT will vary depending on the frequency range you are looking at. For blue and fin whales we will use 512
Set %Overlap to 90
Brightness should be between 0-10dB
Contrast should be around 100%dB
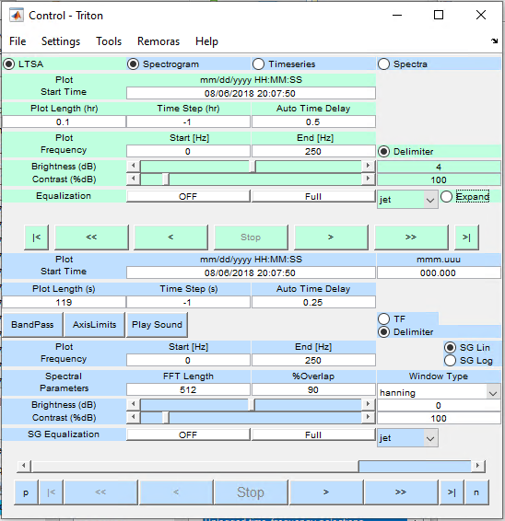
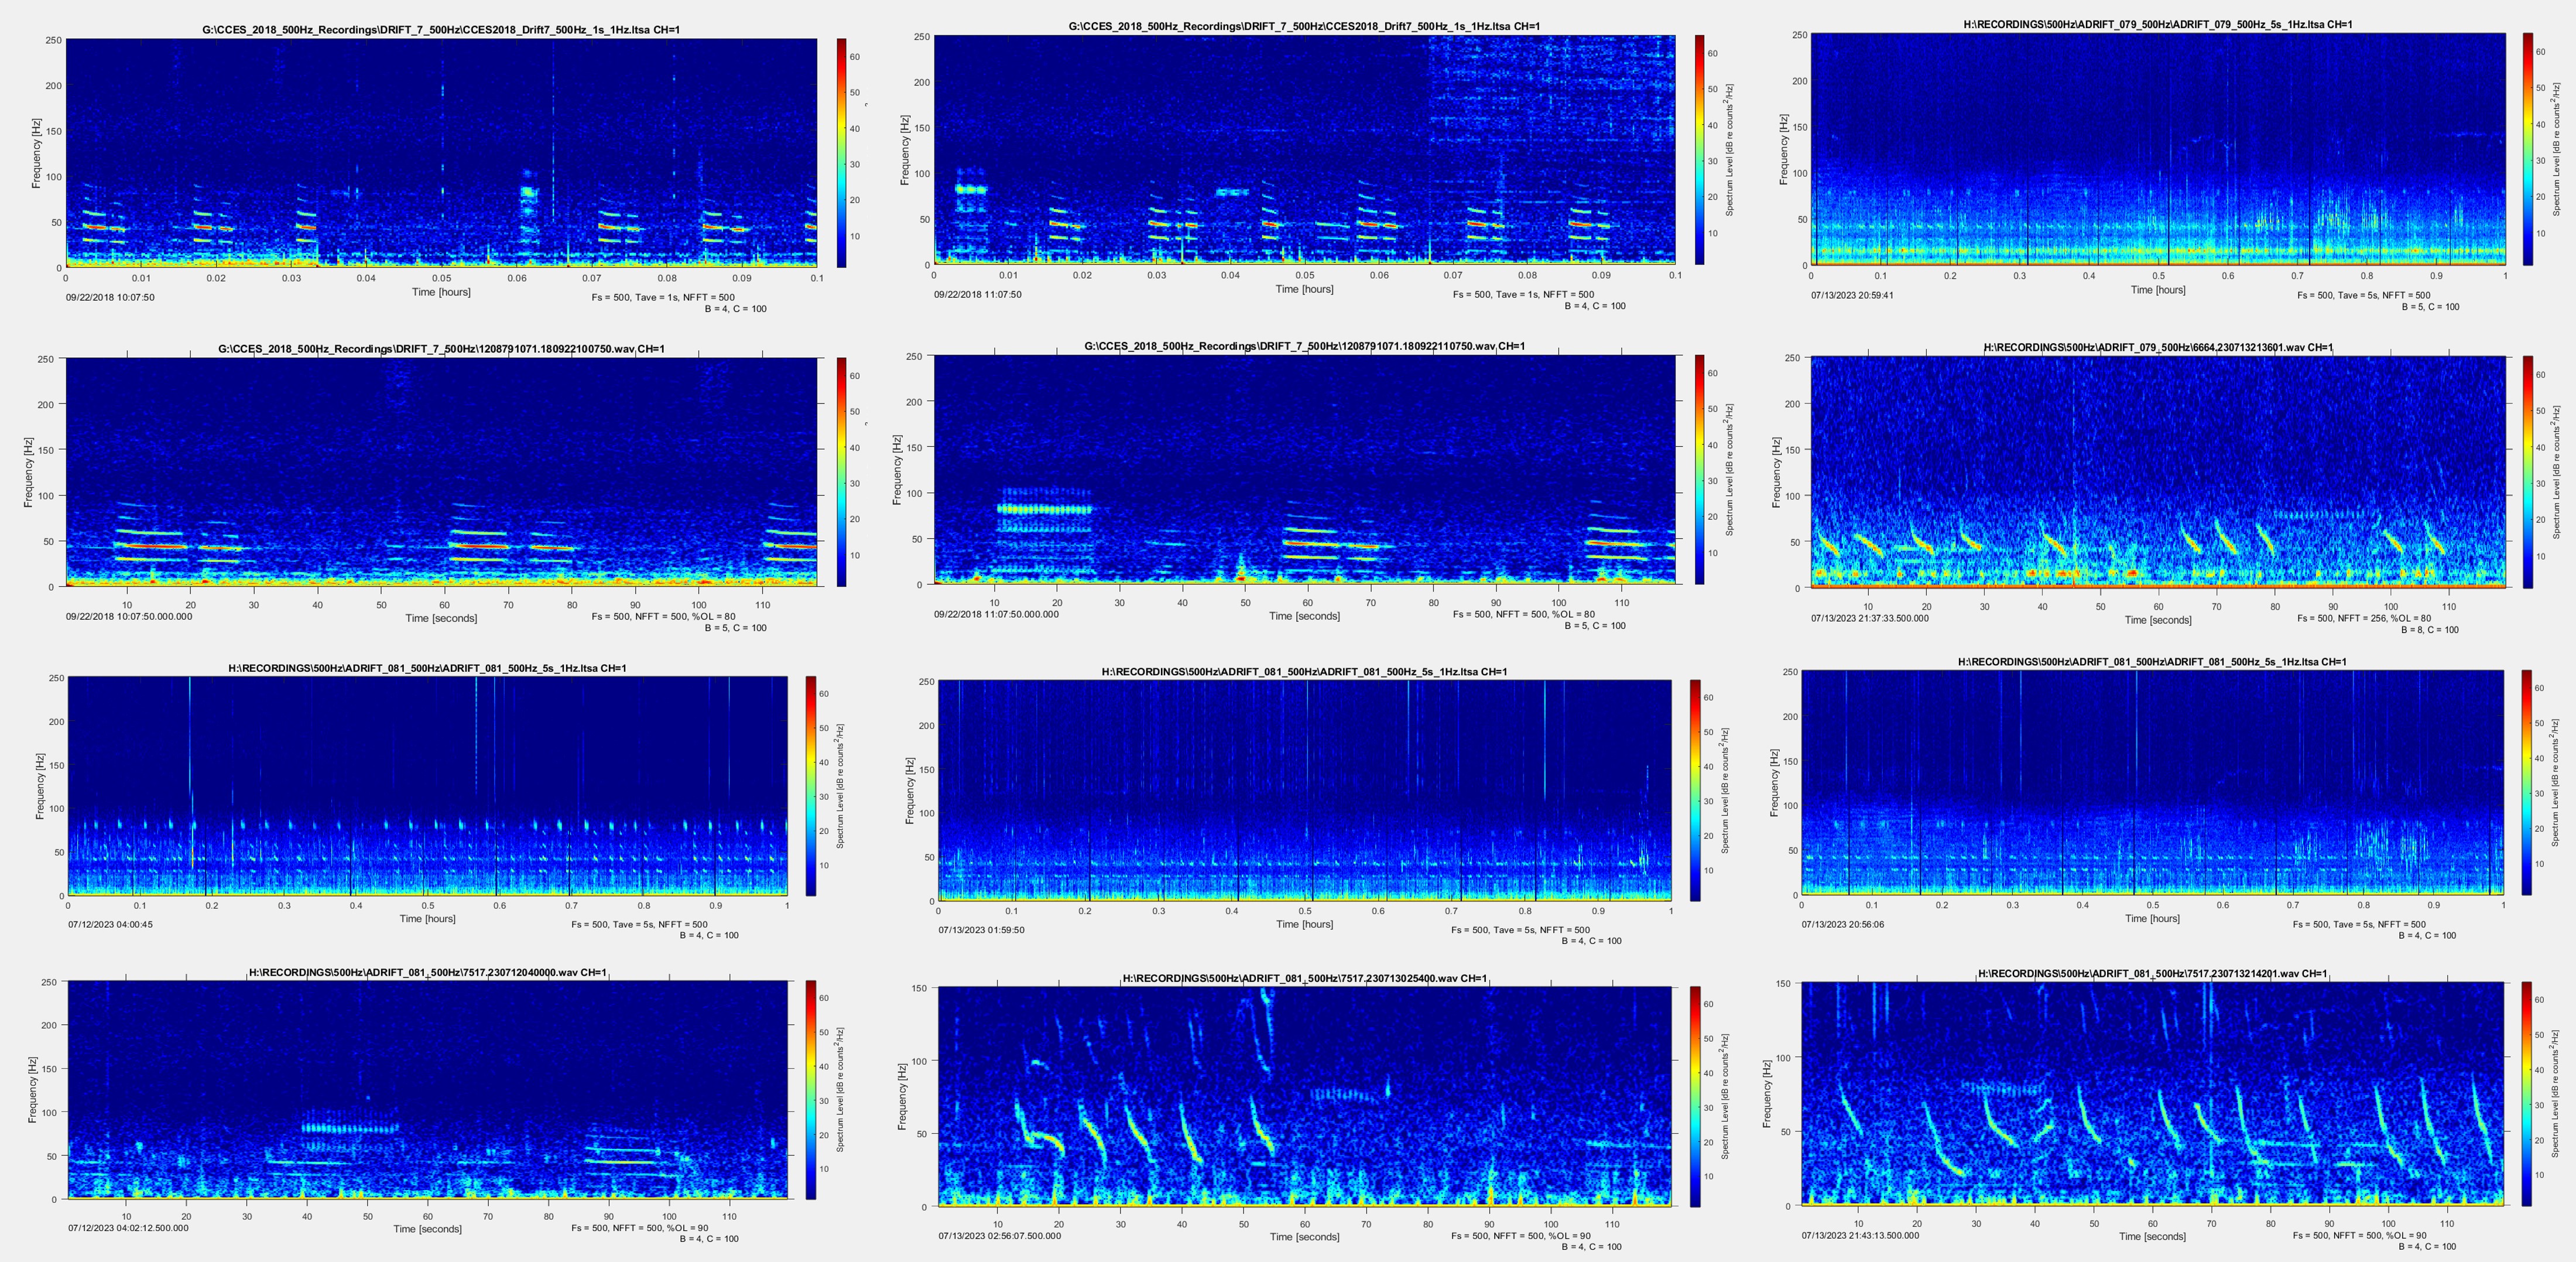
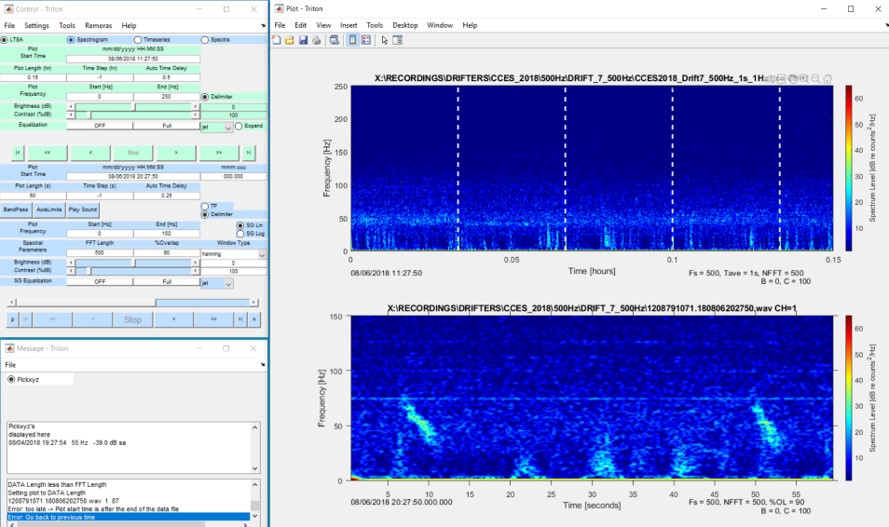
Now you Triton windows should look something like this
Examples of SNR 1 Calls
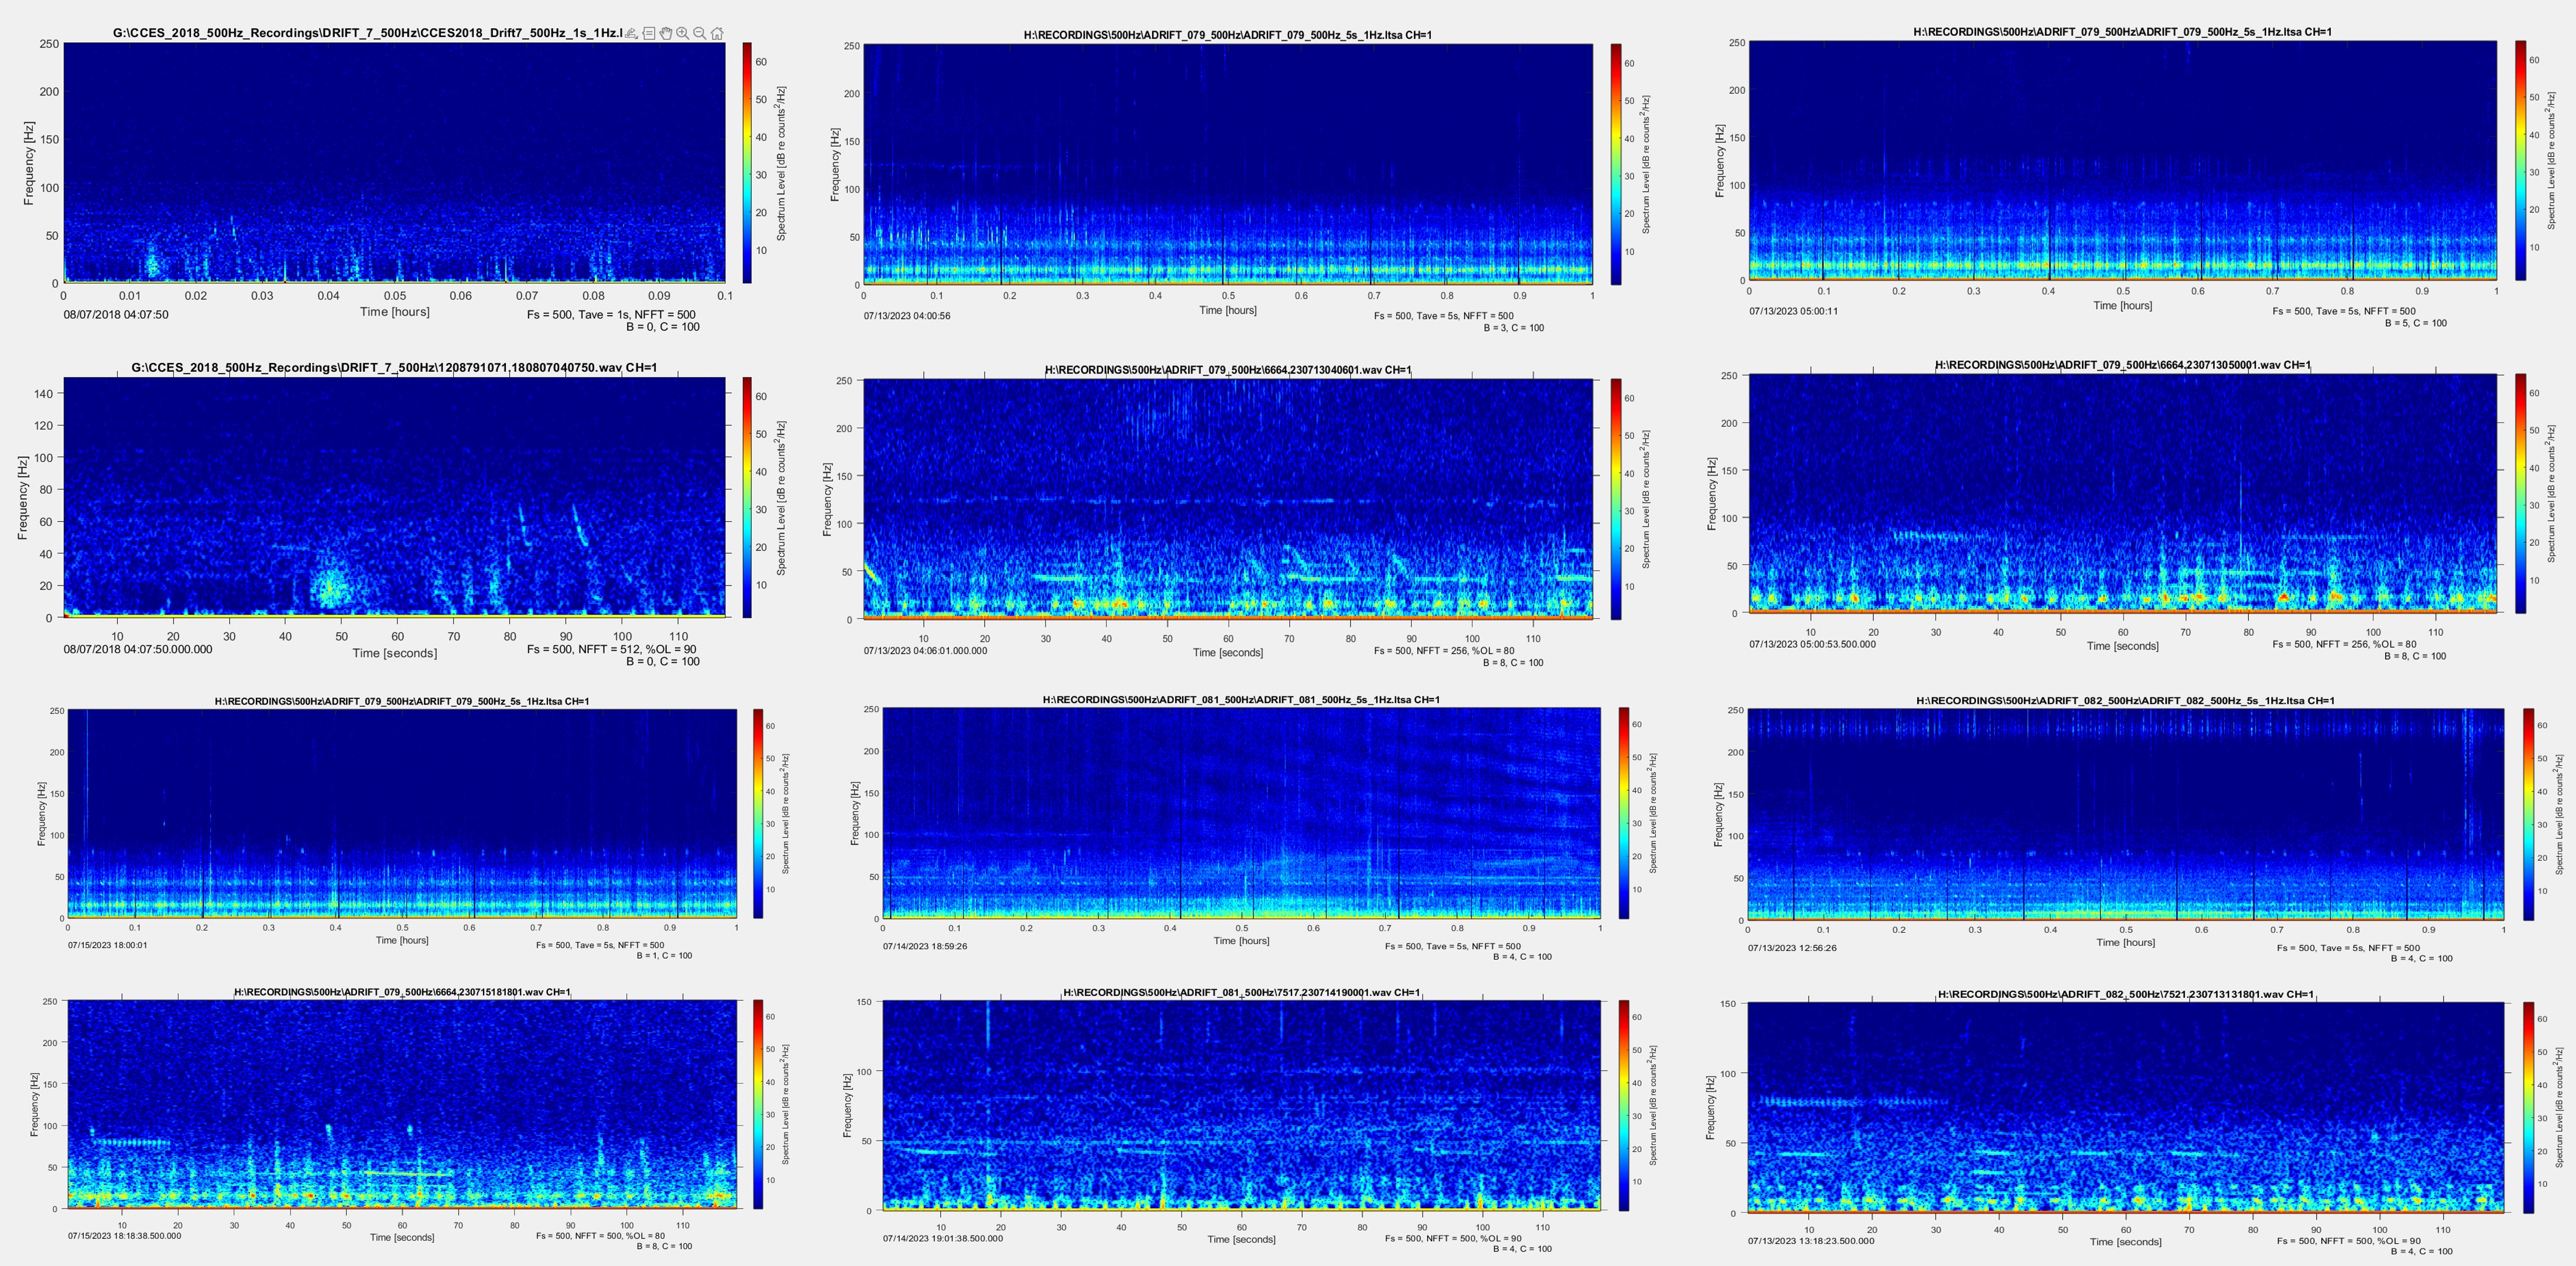
Examples of SNR 2 Calls
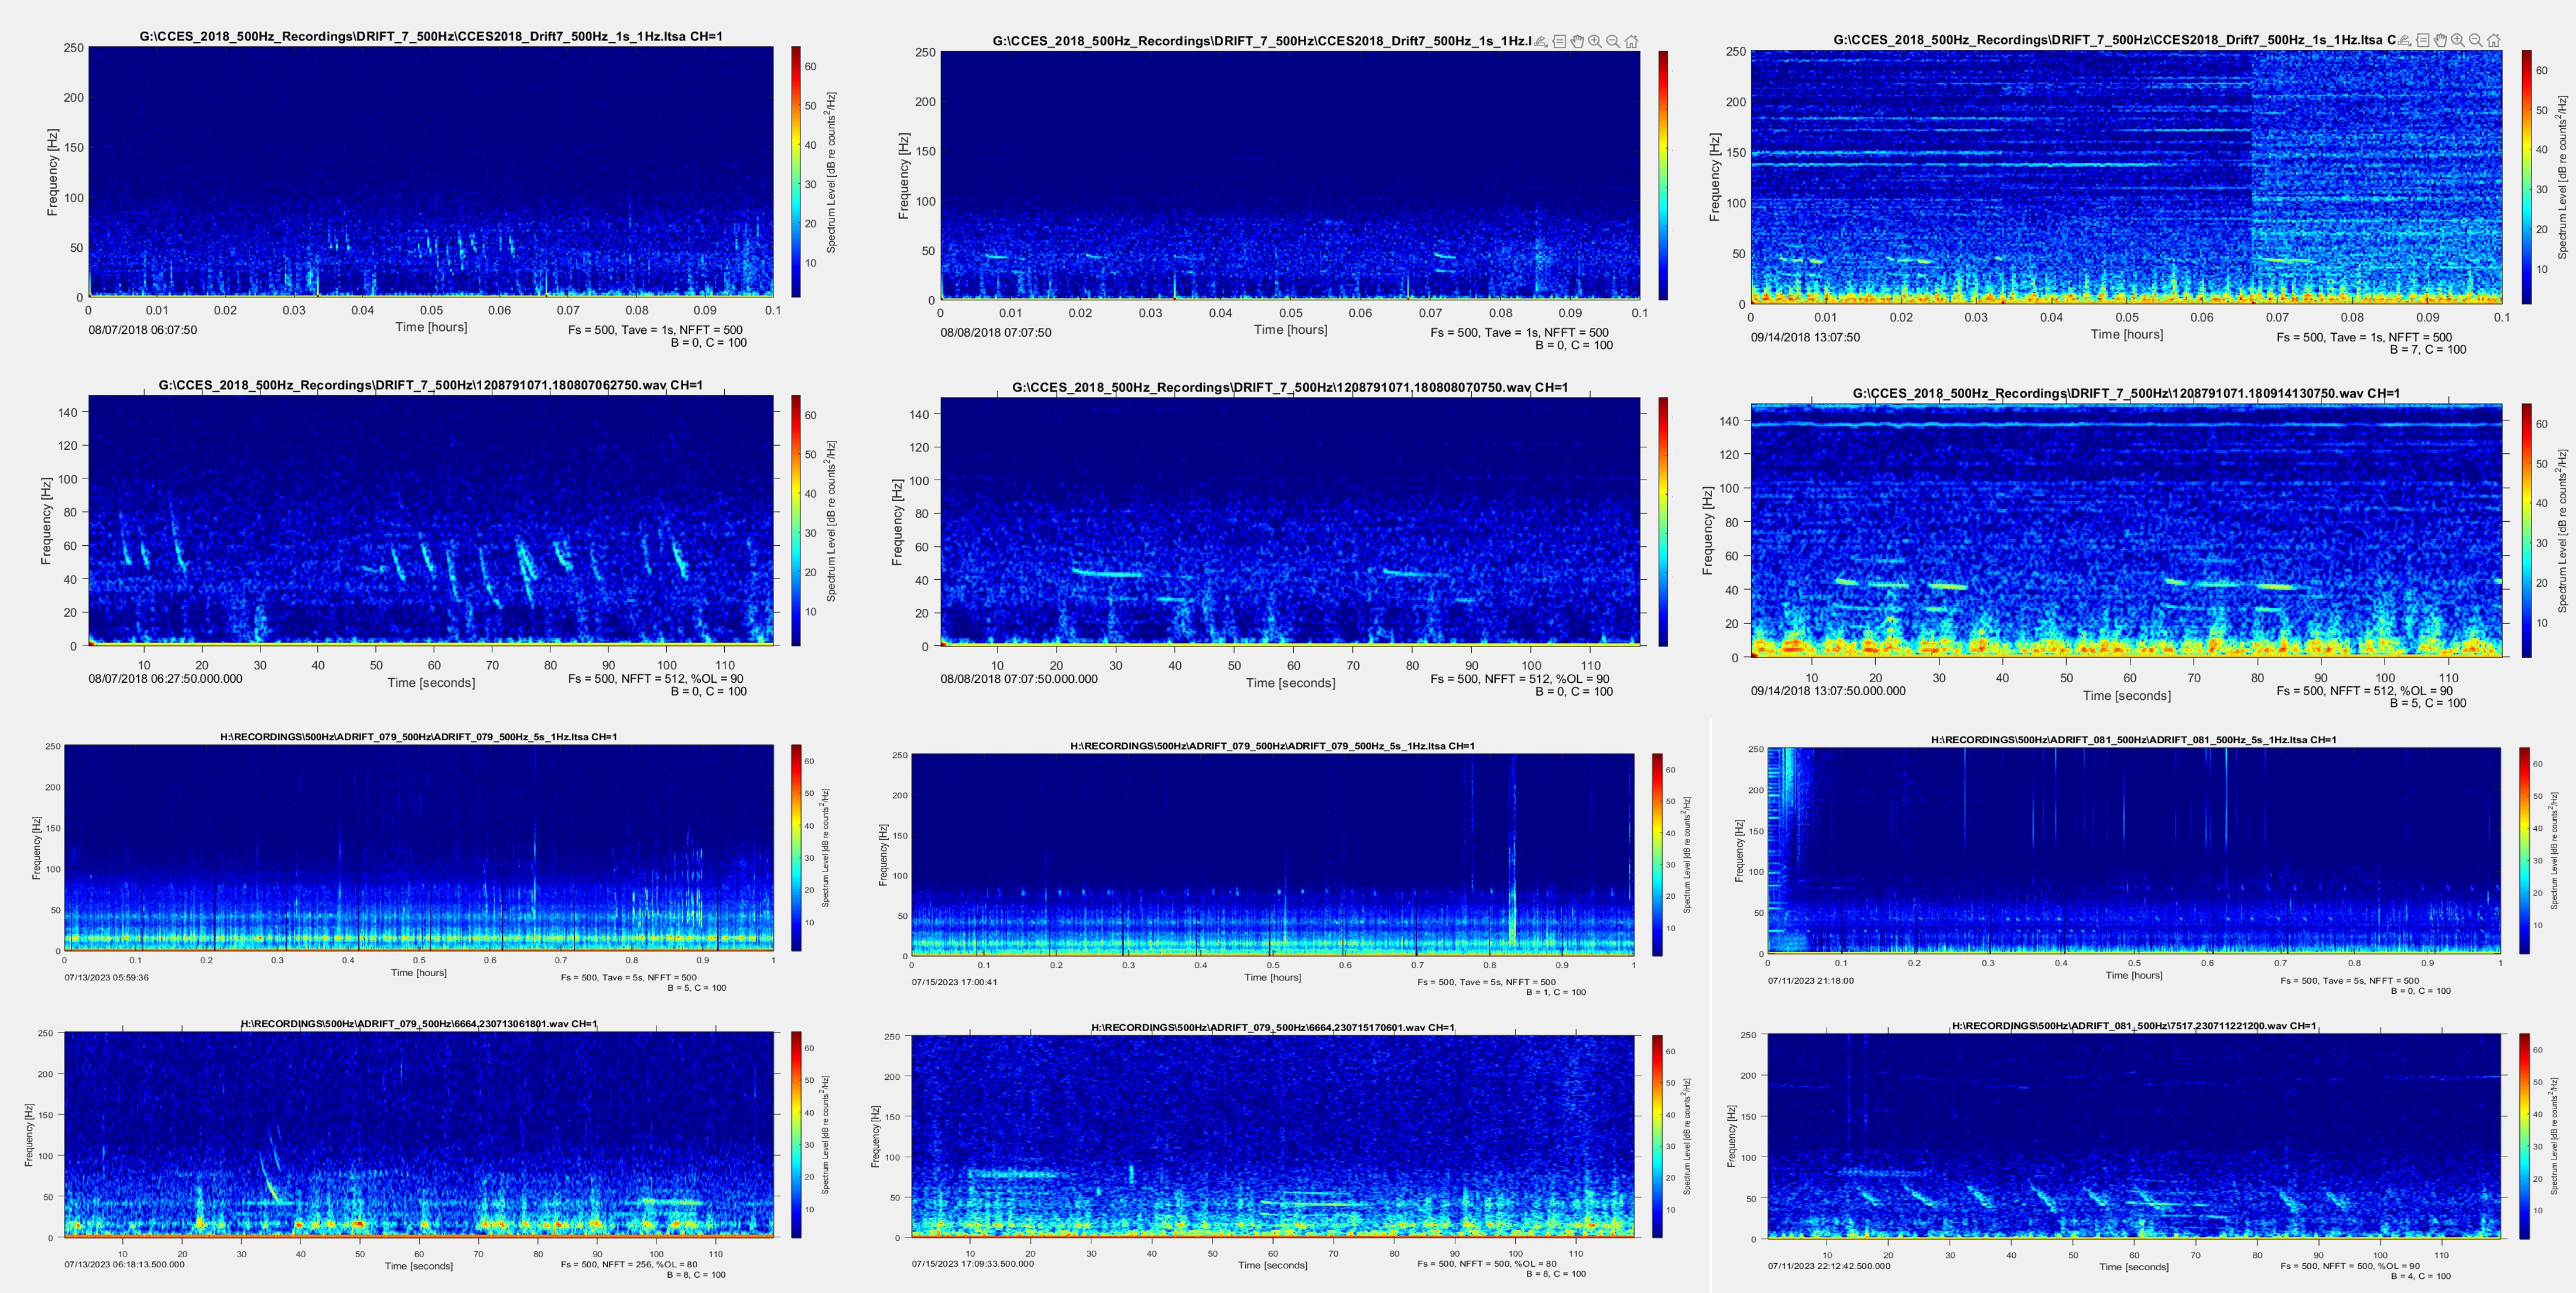
Examples of SNR 3 Calls
Examples of B(bad) Recordings
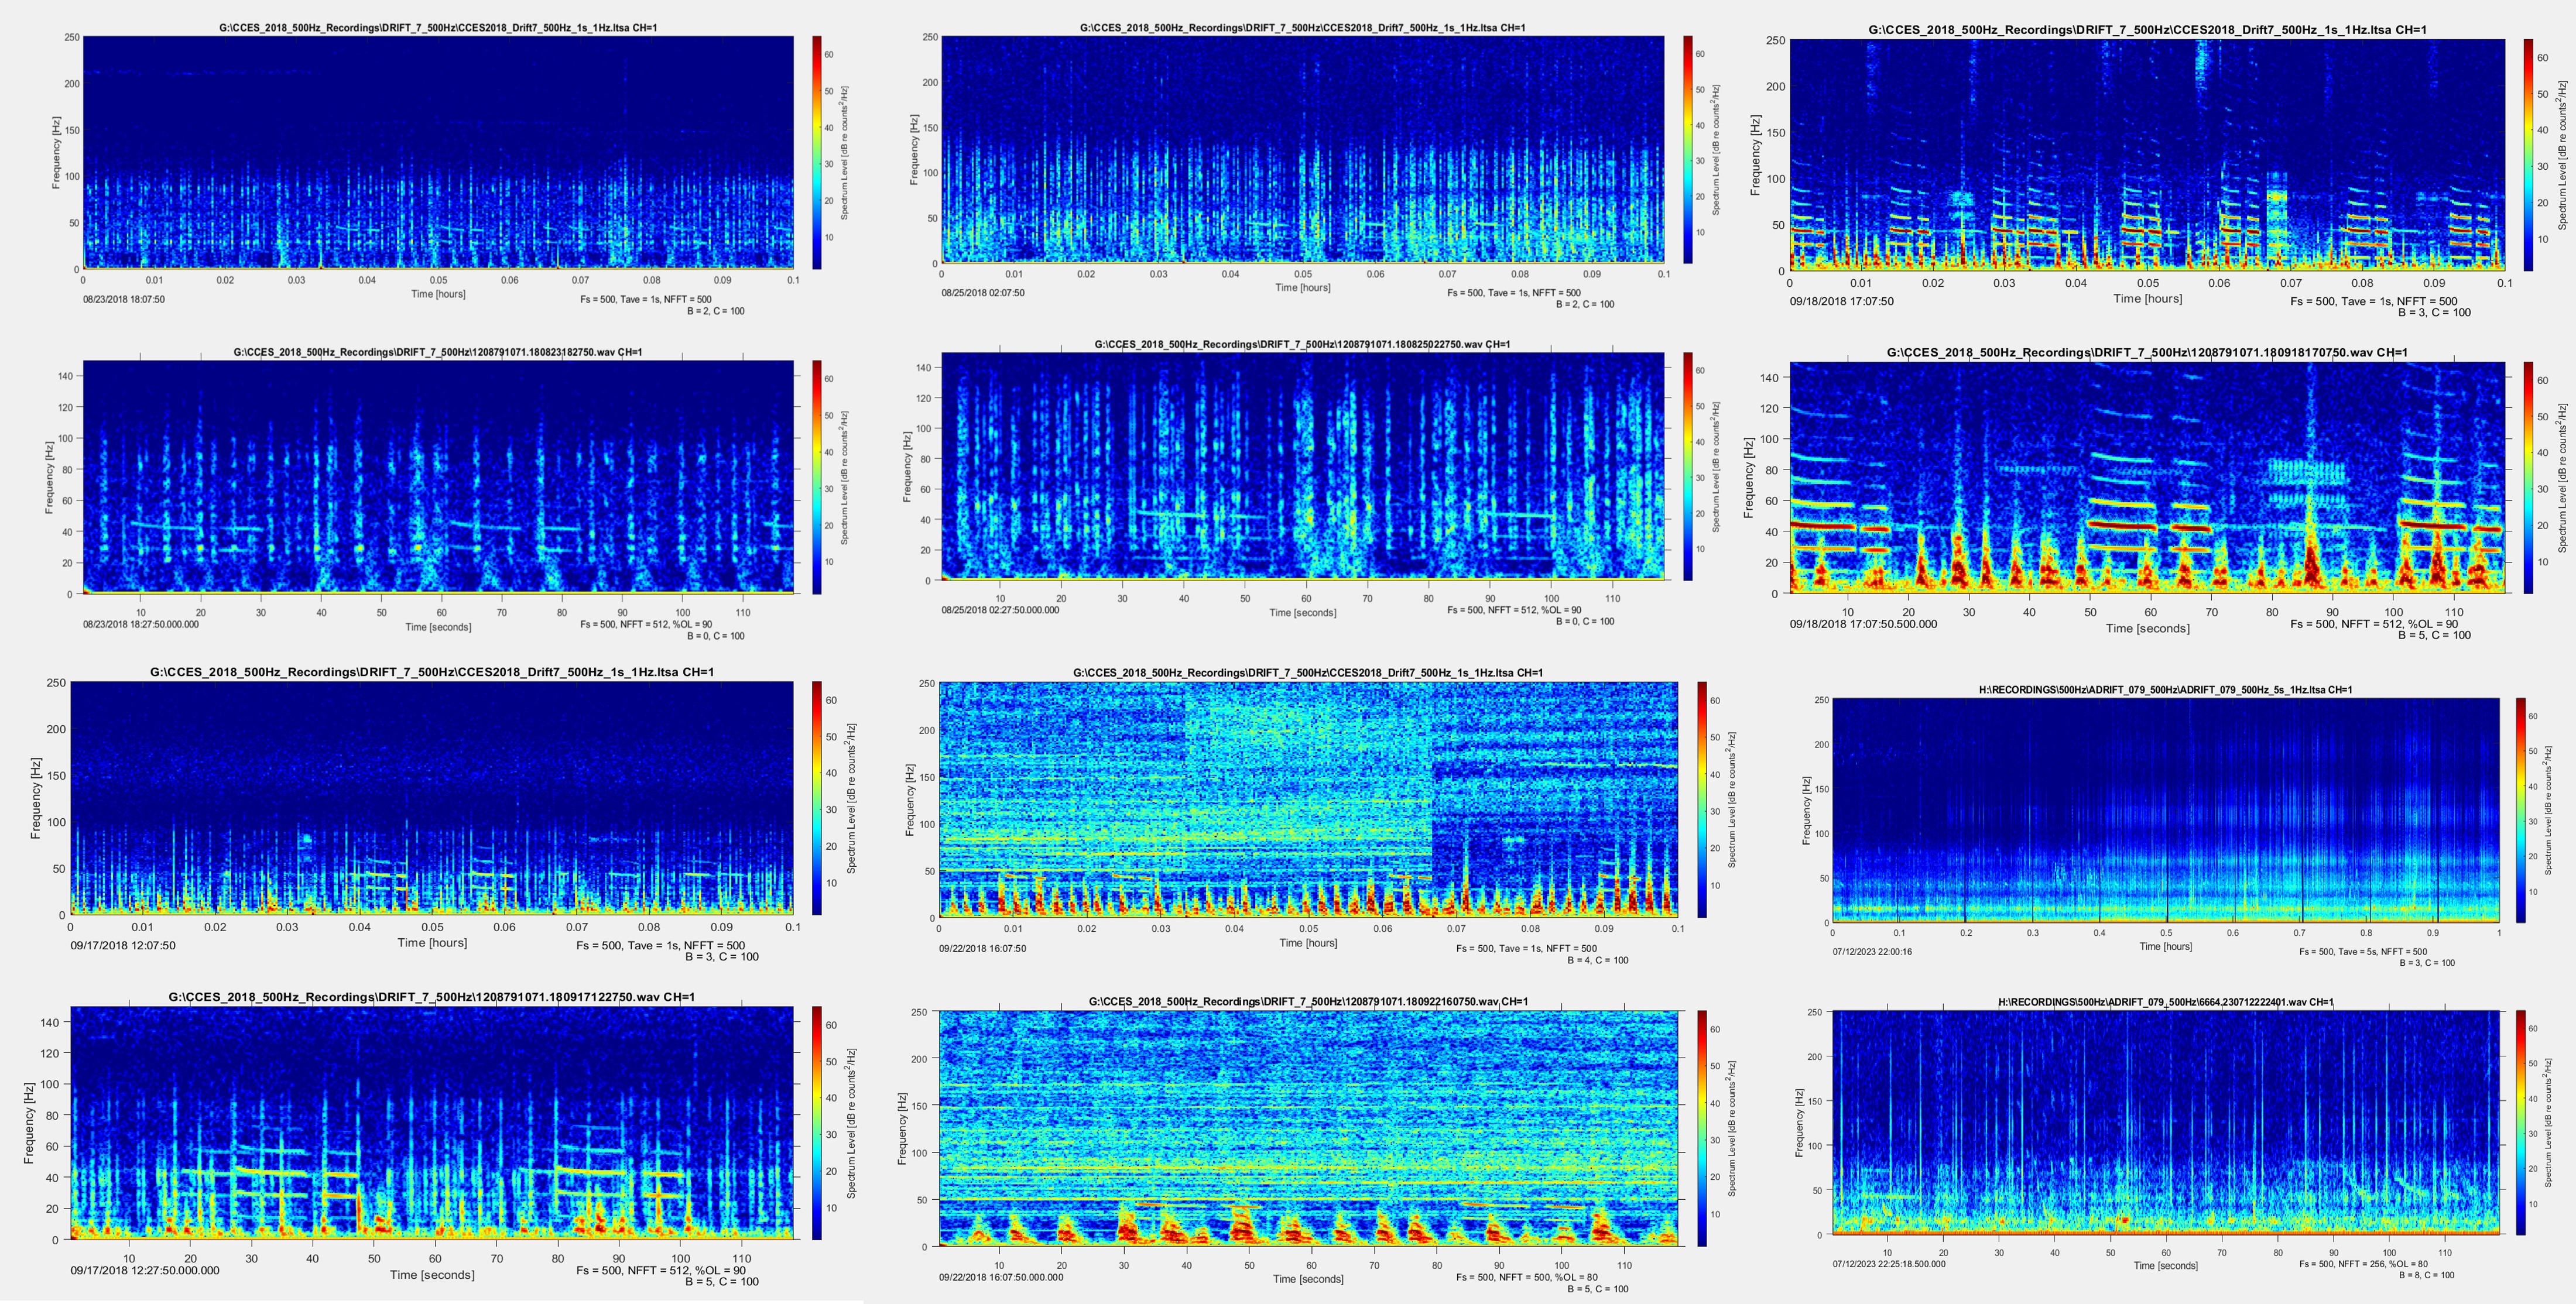
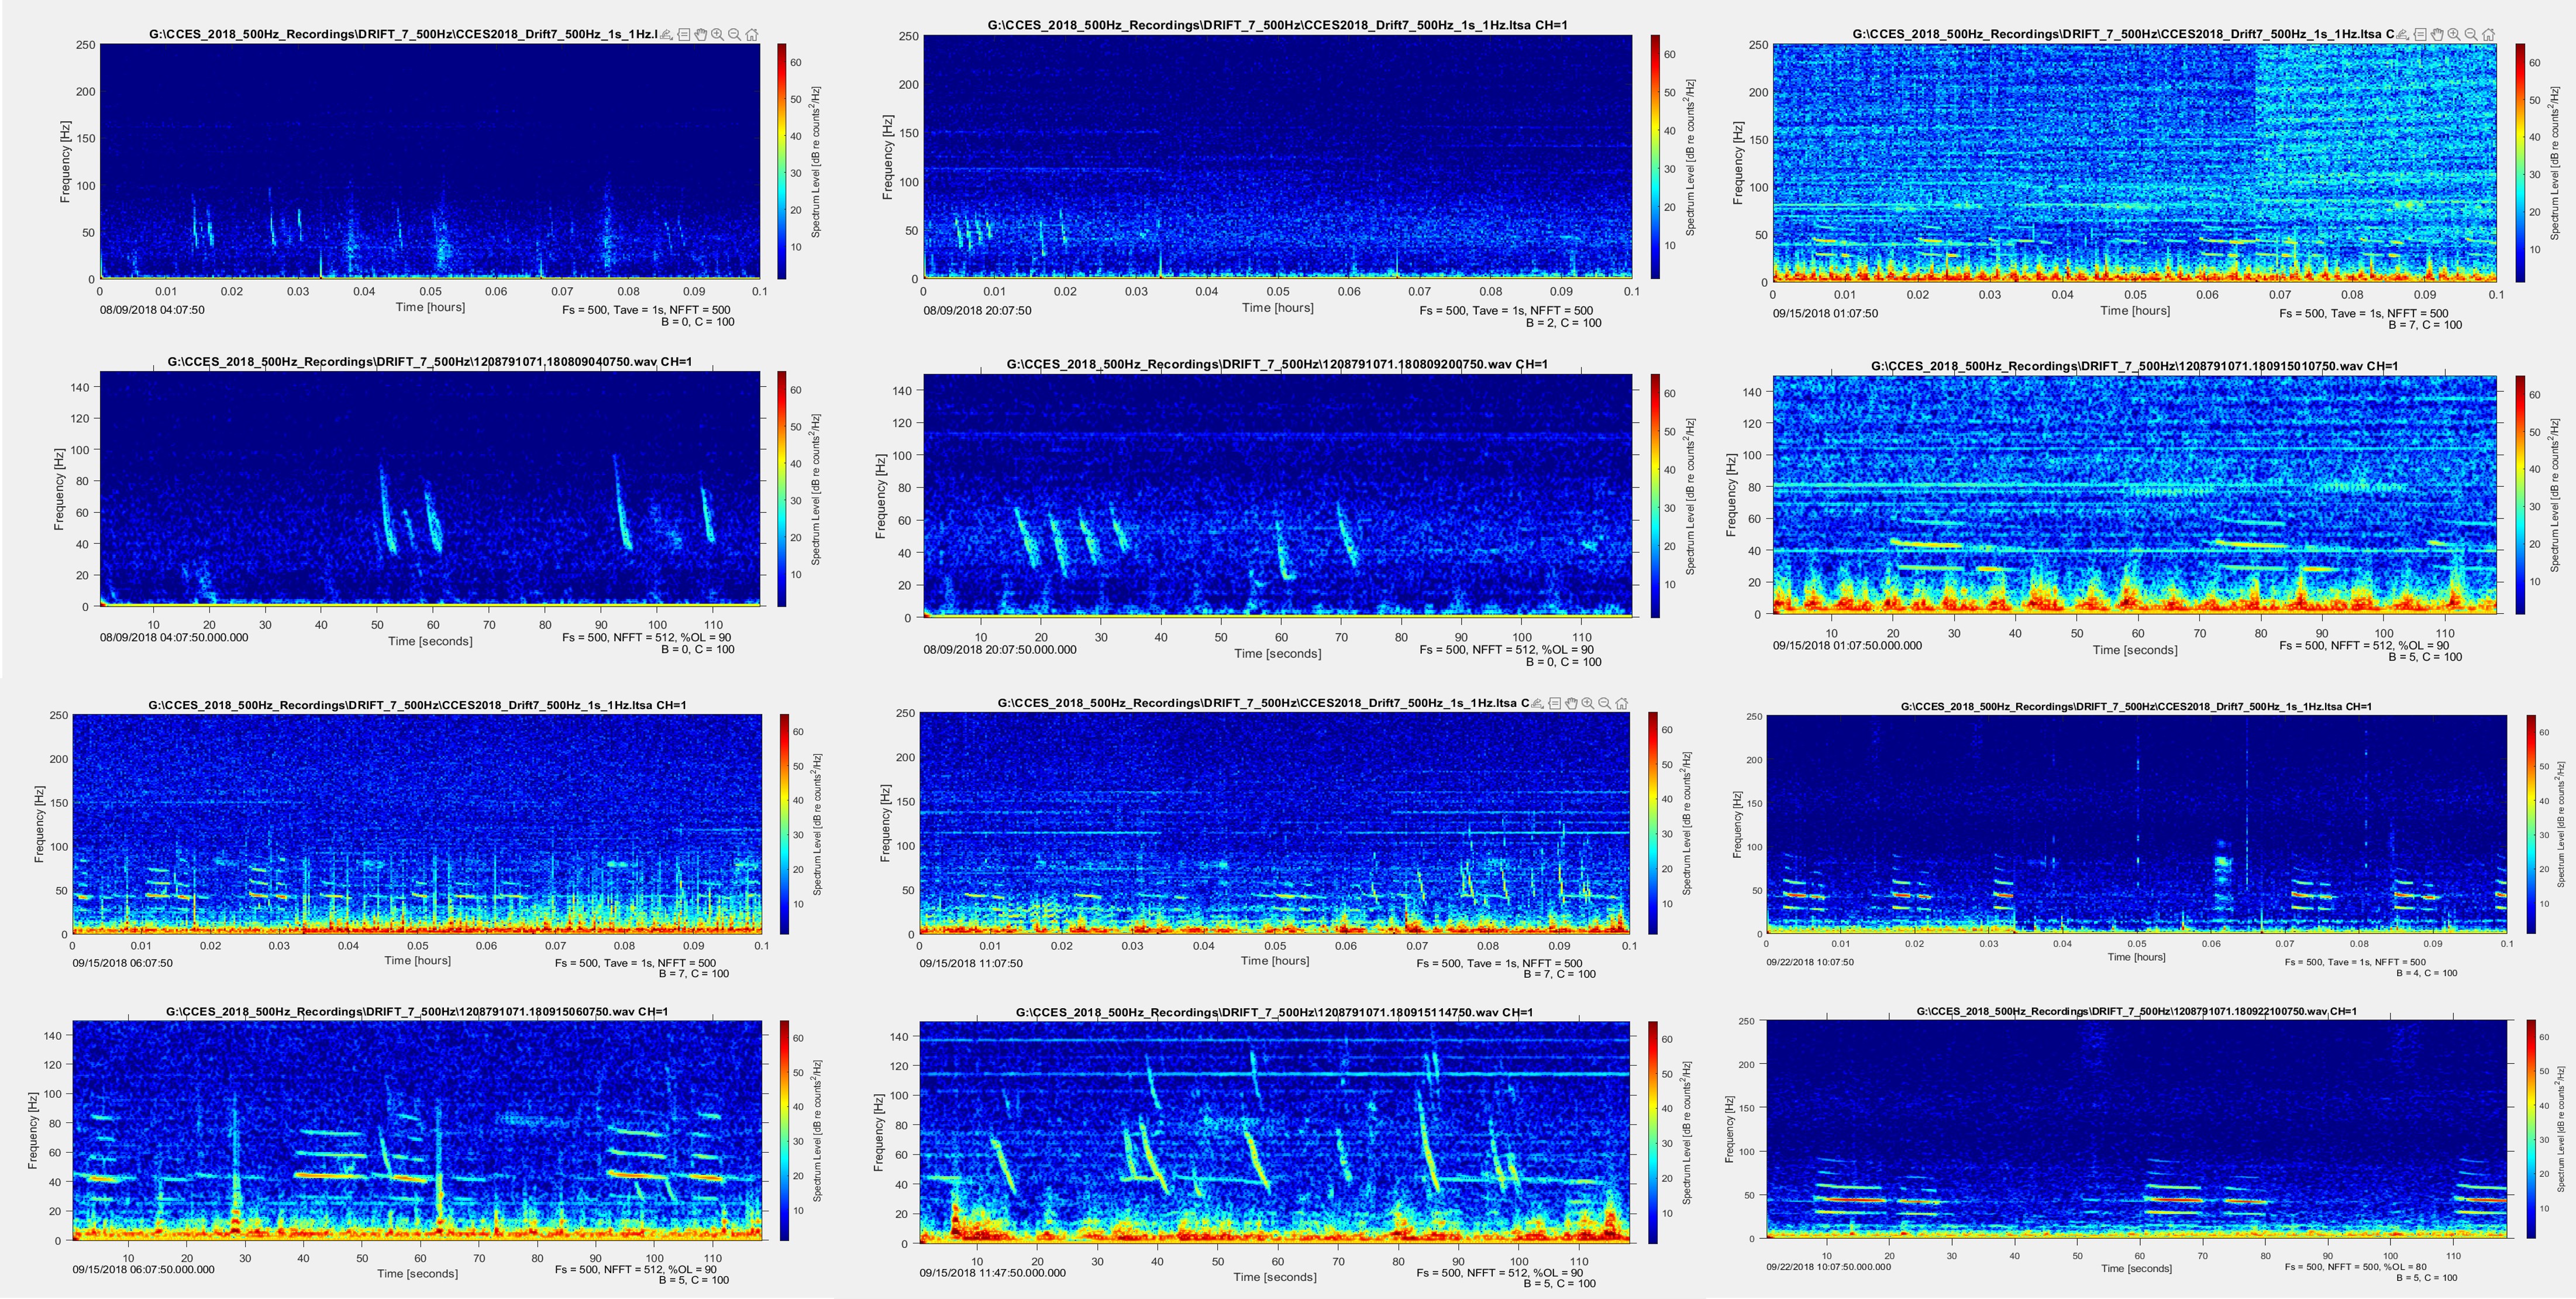
Examples of G(good) Recordings