# PAMpal simple example
# Its on CRAN. Yay!
# install.packages('PAMpal')
# Sometimes I fix things and theyre only available on the GitHub version
# Right now there are some things that run a lot faster on teh GitHub version so I recommend installing that.
# updated 22-12-6 to include loop for PG event adding w/PAMmisc
rm(list=ls())
devtools::install_github('TaikiSan21/PAMpal')
devtools::install_github('TaikiSan21/PAMmisc')
library(PAMpal)
library(PAMmisc)

# Start by creating a "PAMpalSettings" object. This keeps track of what data you want to process and what processing you want to apply to it.

# Change paths below to your DB and binary folder. Can just be the highest level binary folder for that drift - it will add all files within that folder recursively through subfolders.

# This will also ask you to type in some parameters for calculations in your console. You can just hit ENTER to accept defaults for all of these, they aren't relevant to the GPL calculations only for clicks.

pps <- PAMpalSettings(db = 'Path to database',
                      binaries = 'Path to binaries',
                      # these parameters are only for the click detector - can ignroe
                      sr_hz='auto',
                      filterfrom_khz=0,
                      filterto_khz=NULL,
                      winLen_sec=.0025)

# Now tell it to process your data. Id is optional and serves no function, but can be useful to tell data apart at a later point in time. Here mode = 'recording' tells it how to organize your data. Most of the time we are working with data that have been marked manually into events, so PAMpal wants to organize things into events. mode='db' uses the events in the database, and only processes the detectoins you've marked out. In this case we just want to process everything, which is what mode='recording' does. It will group them into events by recording file.

# This might take some time to read in events after processing in order to get the time
#data <- processPgDetections(pps, mode='db', id='Minke_CCES_019')

data <- processPgDetections(pps, mode='recording', id='Species_Project_Drift#')

# And here's how you can get the detections information out of "data" as a dataframe. Time column is "UTC", other columns are stuff it measured.
gplDf <- getGPLData(data)

# Now we can add the wav files to this data. You might get a warning about "startSample", its safe to ignore that.
data <- addRecordings(data,
                      folder='Path to wav files')

# that data is stored here as a dataframe. Has "start" & "end" as POSIXct and the fulle path to the file as "file"
wavDf <- files(data)$recordings

# add number of detections to this
nDets <- sapply(events(data), nDetections)
nDets <- data.frame(join=names(nDets), nDets=nDets)
wavDf$join <- basename(wavDf$file)
wavDf <- left_join(wavDf, nDets)
wavDf$join <- NULL
wavDf$nDets[is.na(wavDf$nDets)] <- 0

nfiles =round(nrow(wavDf)*.2)
randStart =sample(1:5,1)

wavDf=wavDf[round(seq(randStart, nrow(wavDf), length.out = nfiles)),]

# If we care about assigning some kind of initial label to these detections. Otherwise ignore.
data <- setSpecies(data, method='manual', value='InitialGPL')

# Add events from wavDf loop
for(e in 1:nrow(wavDf)) {
  thisEv <- data[[basename(wavDf$file[e])]]
  # this will get all detector types, if just one type is wanted can be simplified to ex. uids <- unique(getGPLData(thisEv)$UID)
  uids <- unique(unlist(lapply(getDetectorData(thisEv), function(x) {
    if(is.null(x)) return(NULL)
    x$UID
  })))

  addPgEvent(db = files(thisEv)$db,
             binary = files(thisEv)$binaries,
             eventType = species(thisEv)$id,
             UIDs = uids,
             type = 'dg',
             start = wavDf$start[e],
             end = wavDf$end[e],
             comment = paste0('Added by PAMpal, event ID: ', id(thisEv)))
}Minke Methods
Overview
Within PAMGuard, a Generalized Power Law detector was used to detect Minke boings. We started with basic GPL settings from Tyler Helble’s PARM files and modified them to fit our data.
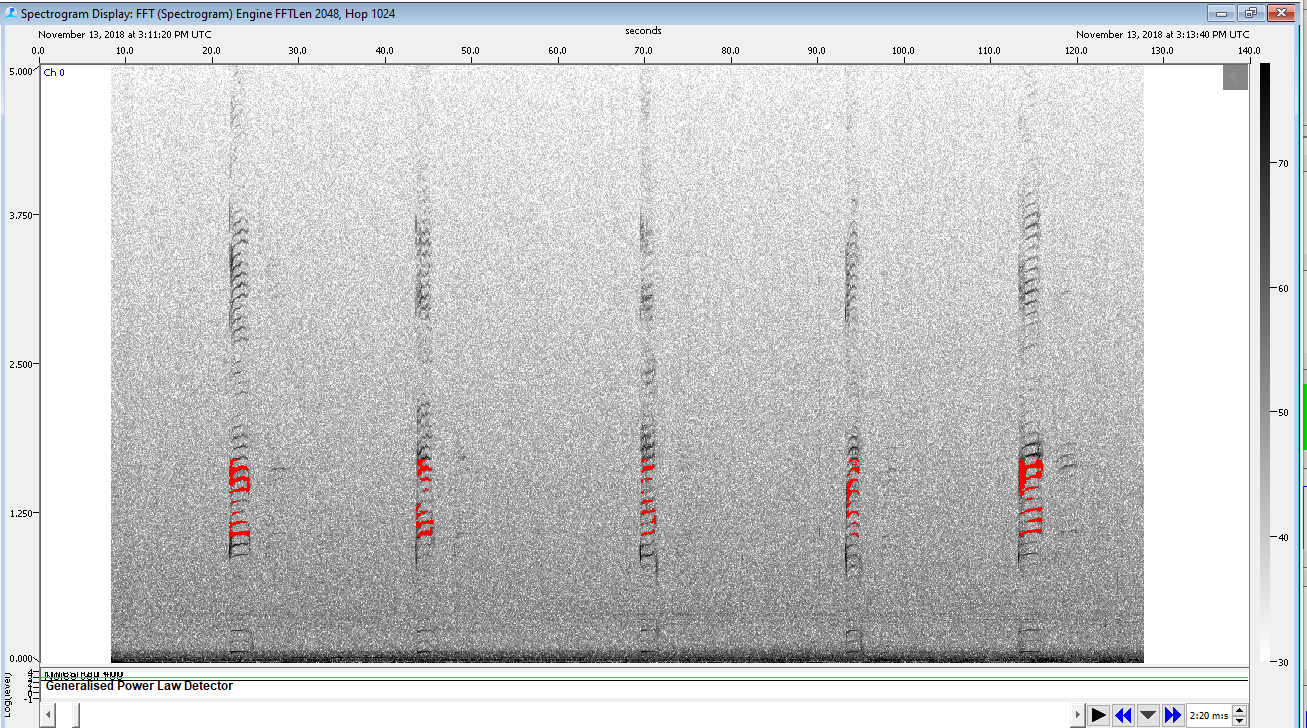
Spectrogram of Minke whale boings being detected by GPL detector
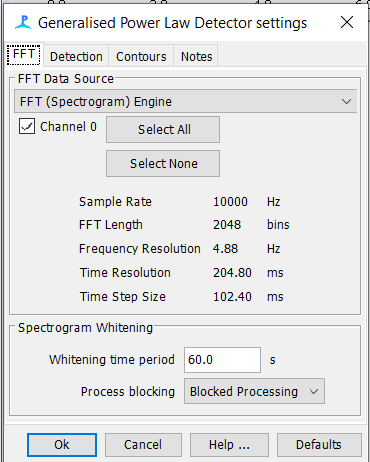
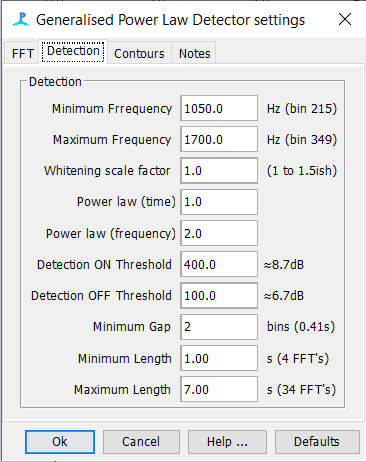
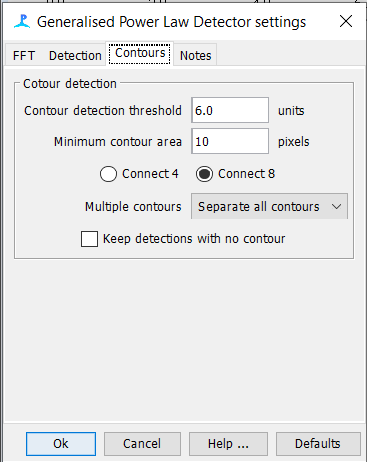
GPL Settings
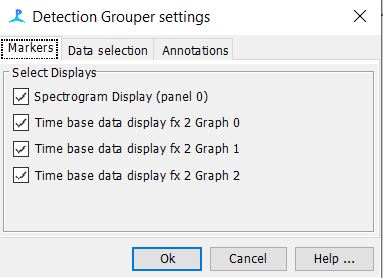
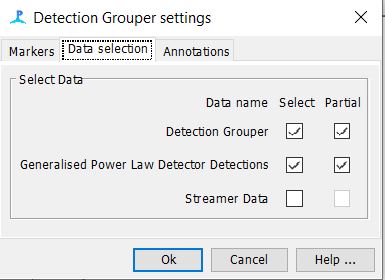
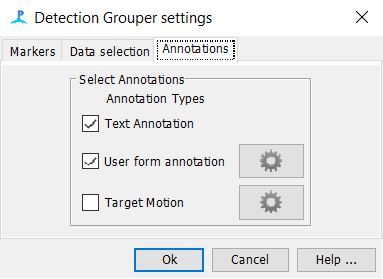
Detection Grouper Settings
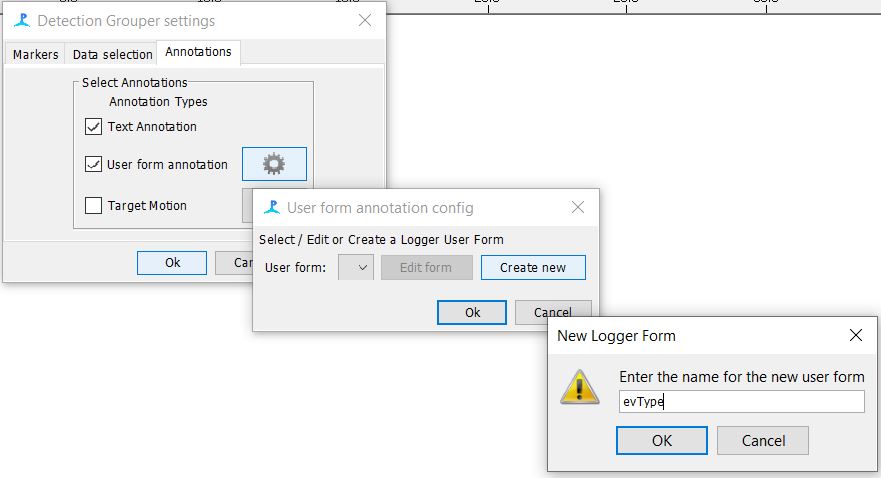
Create New User Form
It is important to note that both the “Text” and “User Form” annotation boxes must be selected
To setup the user form annotation (click on the gear icon)
Create new user form
Label the form “evType” then click ok
Edit User Form & Add Lookup Table
Next click “edit form”
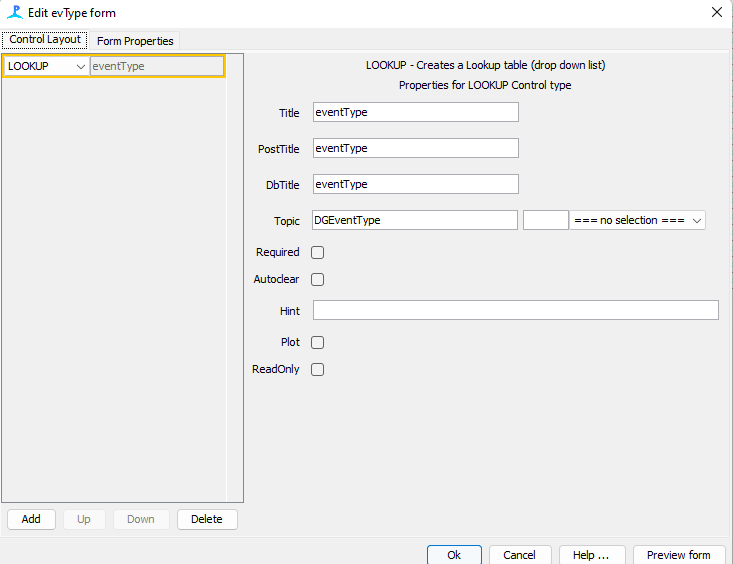
Add a lookup table and fill it out exactly as follows (see figure x.)
Title: eventType
PostTitle: eventType
DbTitle: eventType
Topic: DGEventType
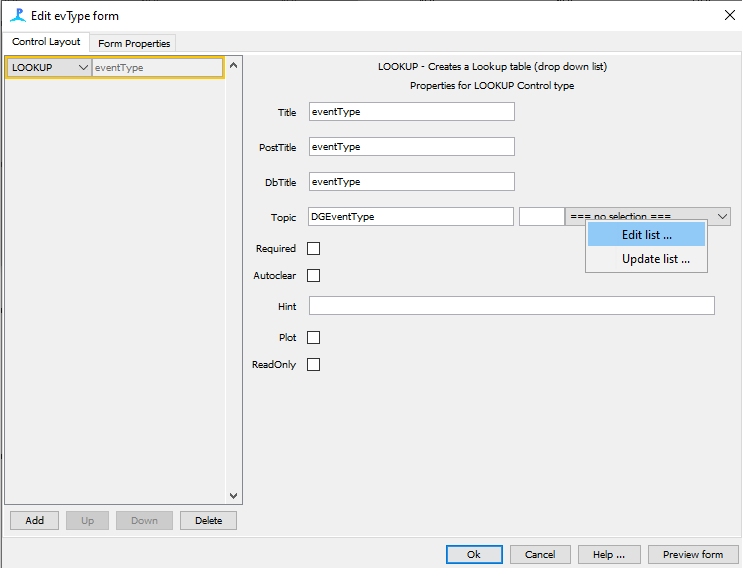
Edit Lookup List
Add selection drop down by right clicking on ‘= no selection =’ and selecting ‘Edit list’
Click ‘Add item’ and fill in species specific options
B - Boing
CB - Cutoff Boing
UB - Unknown Biological Sound
UA - Unknown Anthropogenic Sound
Click ‘Ok’ to close all of the tabs and return to Pamguard Viewer window
Add Spectrogram Annotation Module
Go to File > Add Modules > Utilities > Spectrogram Annotation
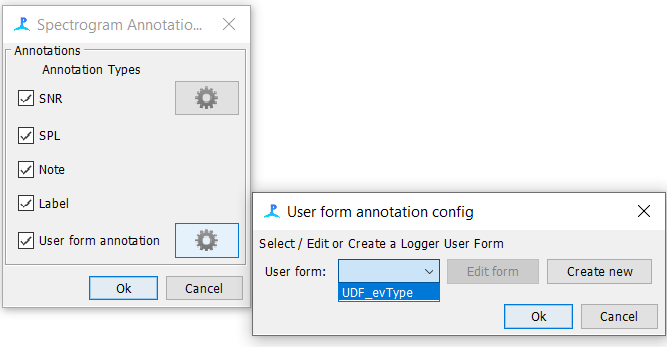
Under ‘Settings’, go to Spectrogram Annotation settings and click on the gear icon next to ‘User form annotation’
Click on the ‘User form’ drop down, select ‘UDF_evType’, and click Ok to return to the Pamguard Viewer window
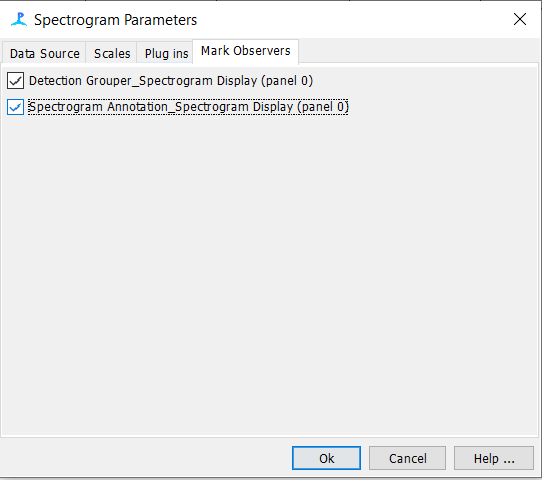
Fix Spectrogram Parameters
Right click on the spectrogram and go to Settings
- Ensure both the ‘Detection Grouper’ and ‘Spectrogram Annotation’ boxes are checked and click Ok
Go to File > Save Data and close Pamguard
Spectrogram Annotation
Using the ‘Generalized Power Law Detector’ Section in the Data Map tab, scroll to detections and center your data there
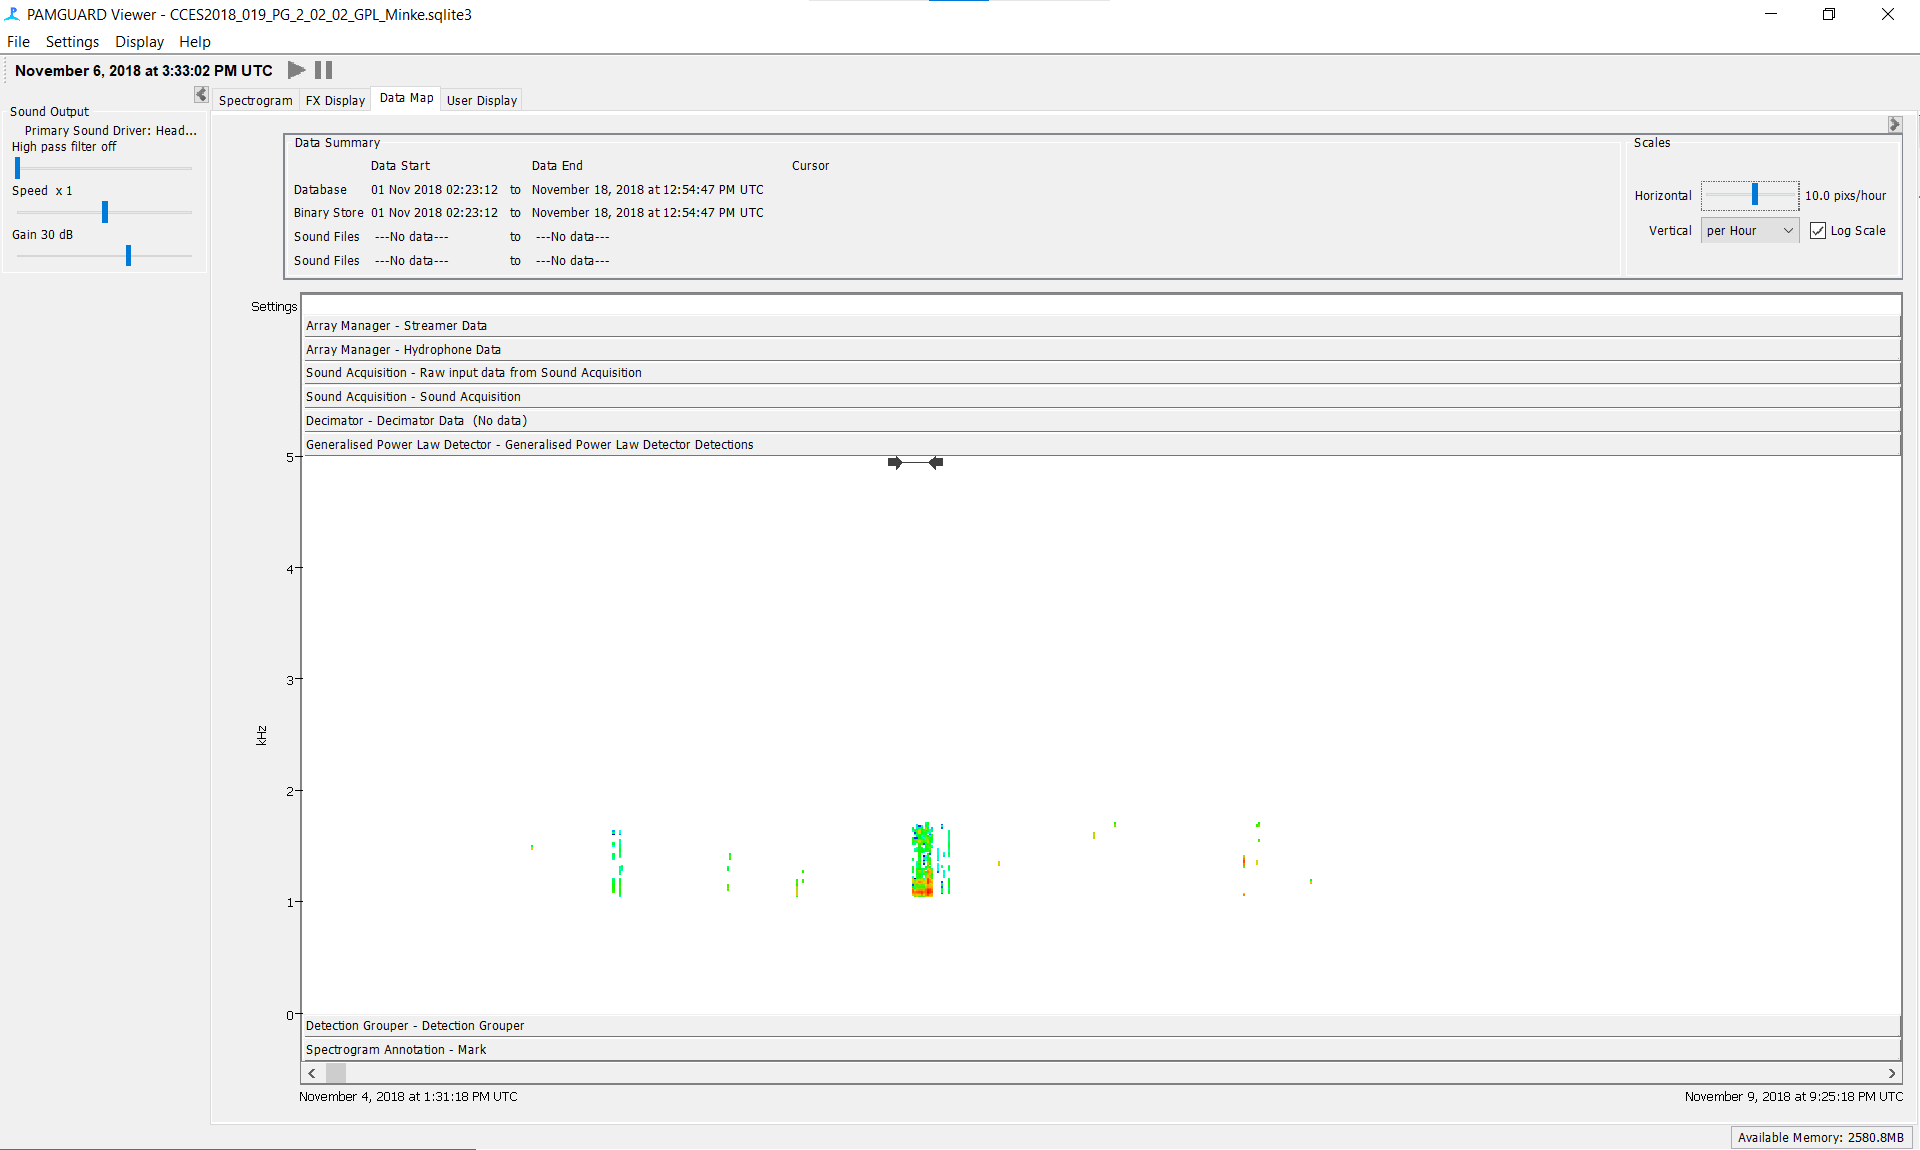
Spectrogram Annotation
Return to the spectrogram view then click and drag to create an annotation box around each boing
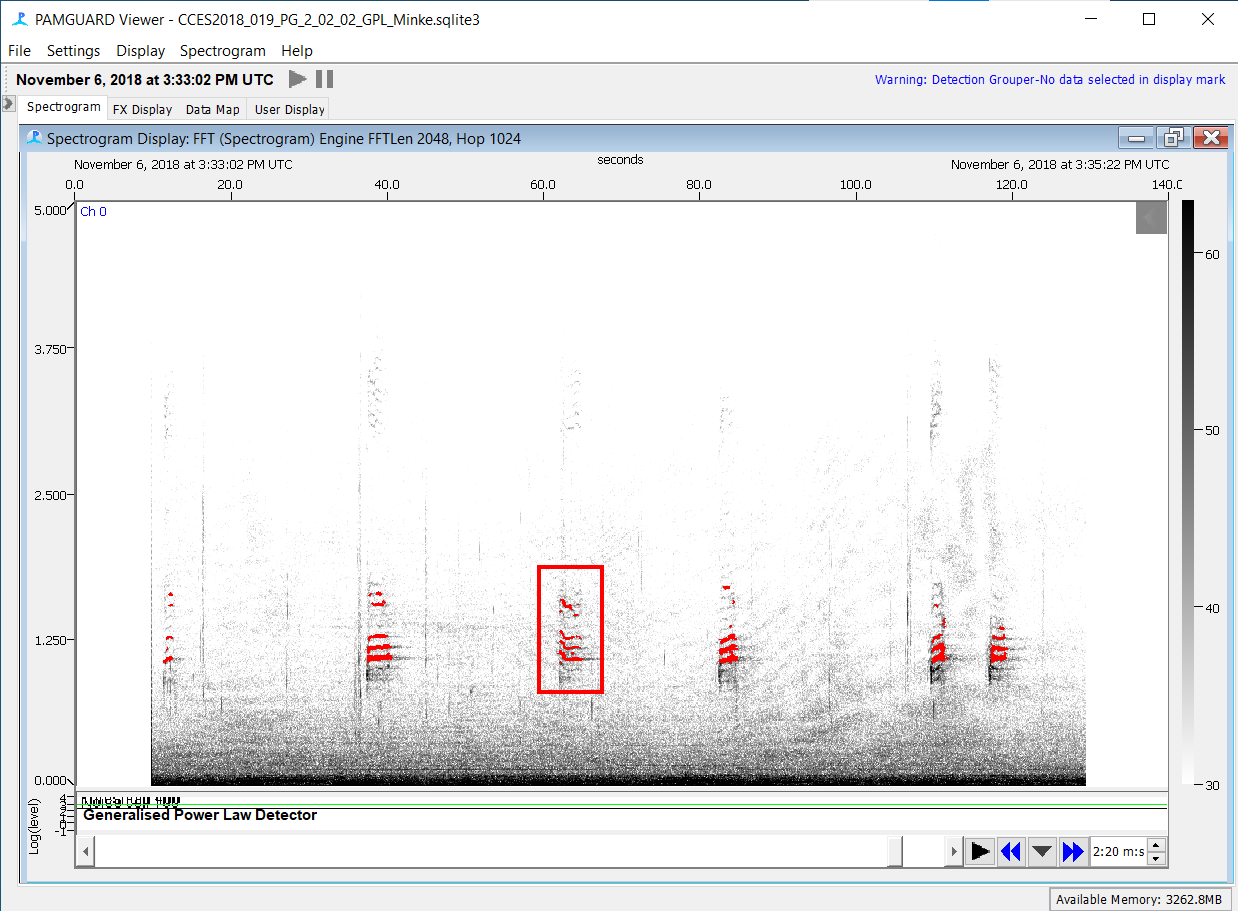
Spectrogram Annotation
A ‘Spectrogram Annotation’ pop up window will appear. In the ‘User form annotation’ section, select the eventType as a ‘Boing’ or other respective option, and press ok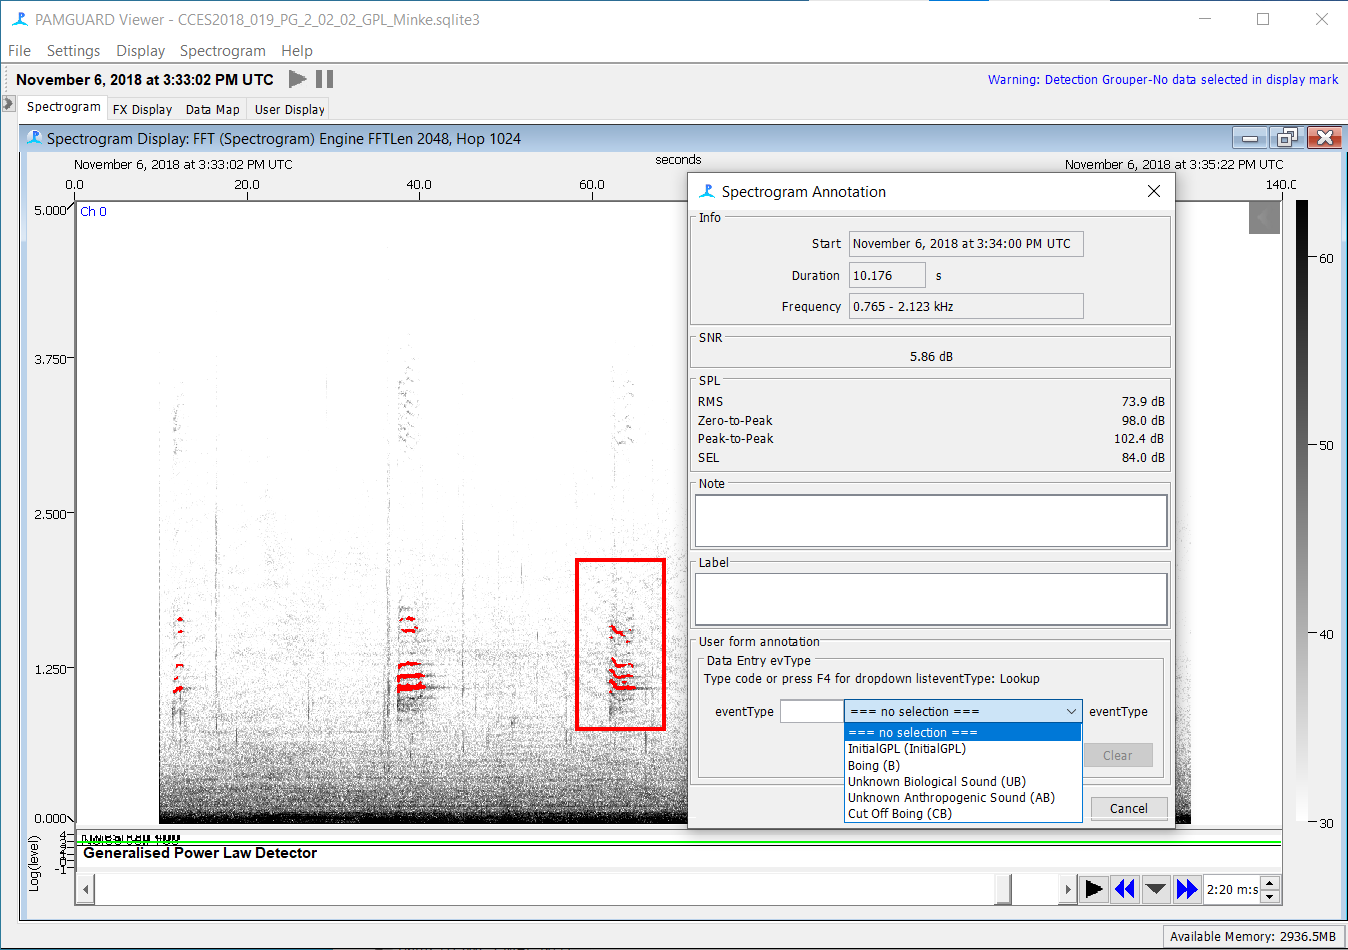
Spectrogram Annotation
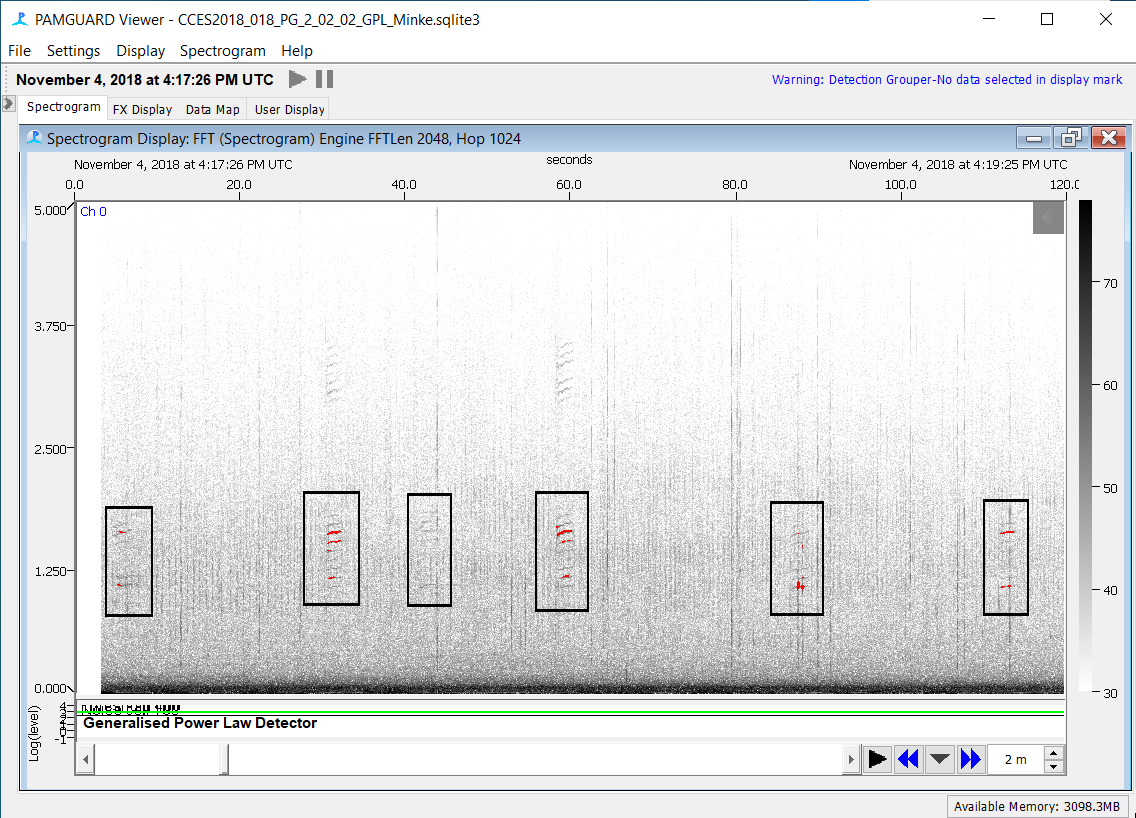
Continue to scan GPL detections and annotate all boings including those missed by the GPL detector, while ignoring false detections
20% Validation Steps
Once you have followed the code above to subsample your data, make a copy of the database in a ‘Data Validated’ folder and reopen the database in Pamguard Viewer
Go to File > Add Modules > Displays > User Display
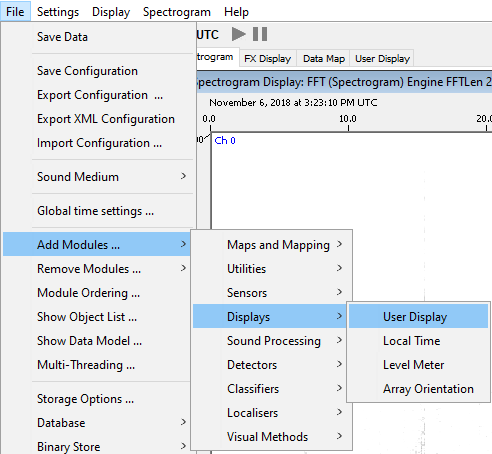
Name the new user display ‘Subsample’
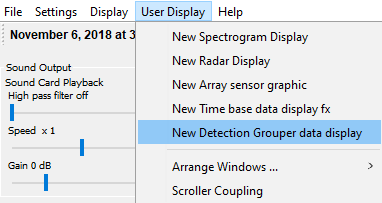
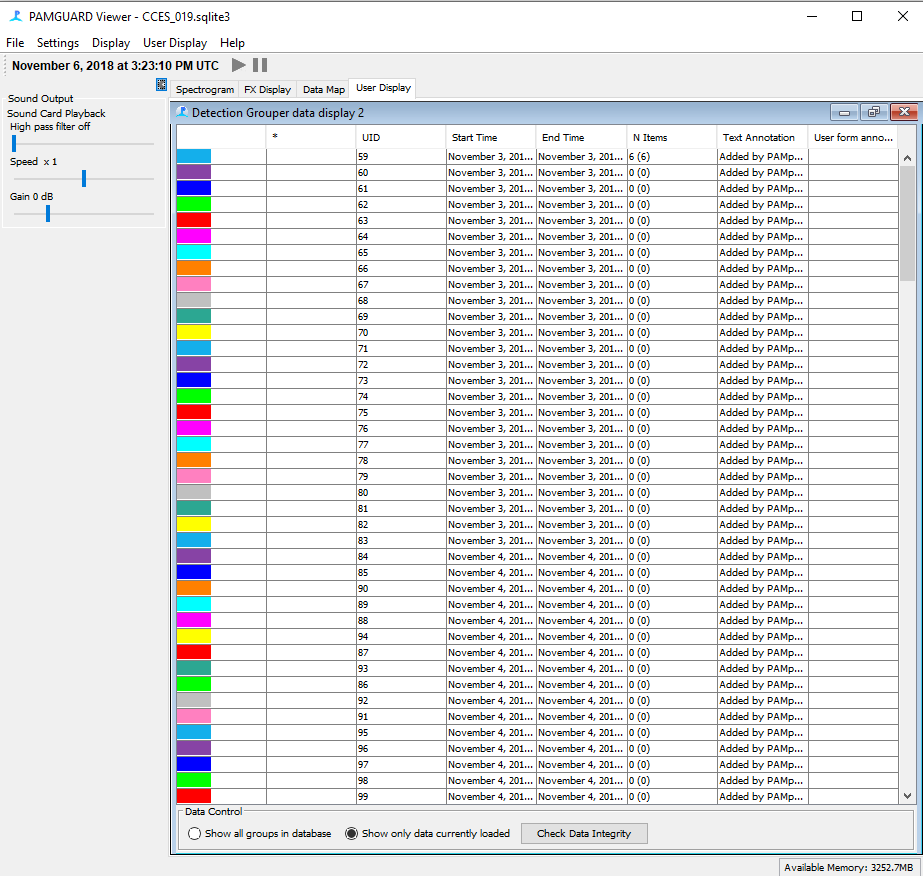
Click on the new subsample tab and go to User Display > New Detection Grouper data display
- Your subsampled data should then be listed with associate marker colors
- Validate each subsampled wav file by scrolling in the spectrogram to the file and scanning for boings