Methods
Field Methods
Sonobuoys are expendable drifting recorders housed in a compact cylinder for deployment from ships or airplanes. When the buoys are deployed, the hydrophone drops to a pre-determined depth and a float inflates at the surface. The multi-plexed signal containing the audio and DIFAR information is transmitted from an antenna embedded in the float; this signal can be received using a VHF receiver. Specialized receivers are required to obtain the full low-frequency audio, and specialized software is required to demultiplex the DIFAR signal. Field methods have evolved over the years from analog to digital formats (sonobuoy guidelines for select years can be found in the repository supplement folder), and Rankin et al. (2019) provides detailed information on using sonobuoys for ceteacean surveys based on decades of research.
Analysis Methods
Most sonobuoys were monitored in real-time by field researchers, and field notes can be found in the fieldNotes folder in the SWFSC-PAM-Sonobuoy github repository.
Select sonobuoy deployments were analyzed for publications, where specific methods are outlined in each publication (see publications)
A standardized review of select sonobuoy is ongoing, as time allows. Analog sonobuoy recordings were digitized by playing back analog recordings through a Soundblaster Extigy sound card to a computer using RavenPro (48kHz sample rate, 16-bit, 10 min file size). Not all analog recordings were digitized; a list of digitized recordings can be found here (LINK). Digitized recordings (wav files) are reviewed in RavenPro. Recordings are scanned twice to better monitor at mid- and low-frequencies.
Standardized Review
Audio files were decimated using [Triton](https://github.com/MarineBioAcousticsRC/Triton) v1.93 at 10x and and 100x, giving 4800 Hz and 480 Hz decimated sample rate, respectively. Data were reviewed at both of these decimation rates for DIFAR buoys, and an additional review at full bandwidth (48 kHz) was conducted for omni directional recordings from so
For mid-frequency review, recordings decimated to 4800 Hz were reviewed using RavenPro Software (v1.6.4). Page size = 60 seconds, 90% increment, 10% step increment. View only spectrogram (not waveform), 2 rows with 512 FFT with 200 Hz to 2400 Hz in window.
Identify Start and End of recordings. For each START (either at the beginning, or after a bout of noise where I selected to END), create a box where the START of the box lies on the noise. Annotate start_end as ‘start’ and NA for others. For each END (either at the end of a good bout of recording or the end of the entire recording), create a box where the end of the box lies on the end of the good recording (note: the end of a good recording can also identify the start of bad noise). If this is the end of a recording, then label the other annotations as “NA”. If this is the end of a good recording but start of noise, label the detection as “noise” and the quality as NA.
Detection of Sounds. Biological sounds were annotated in Raven.
Playback Experiment and Methods Development
In 2016, SWFSC conducted a playback experiment for the purpose of estimating the precision and accuracy of bearing angle estimation. This was part of a larger Navy-funded project to investigate the potential for using sonobuoys as a tool to estimate cetacean density in offshore waters (Rankin et al. 2017). This data has been useful for methods development on several projects, and this data is publicly available for future projects (Link to NCEI Data Portal).
Acoustic Spatial Capture Recapture
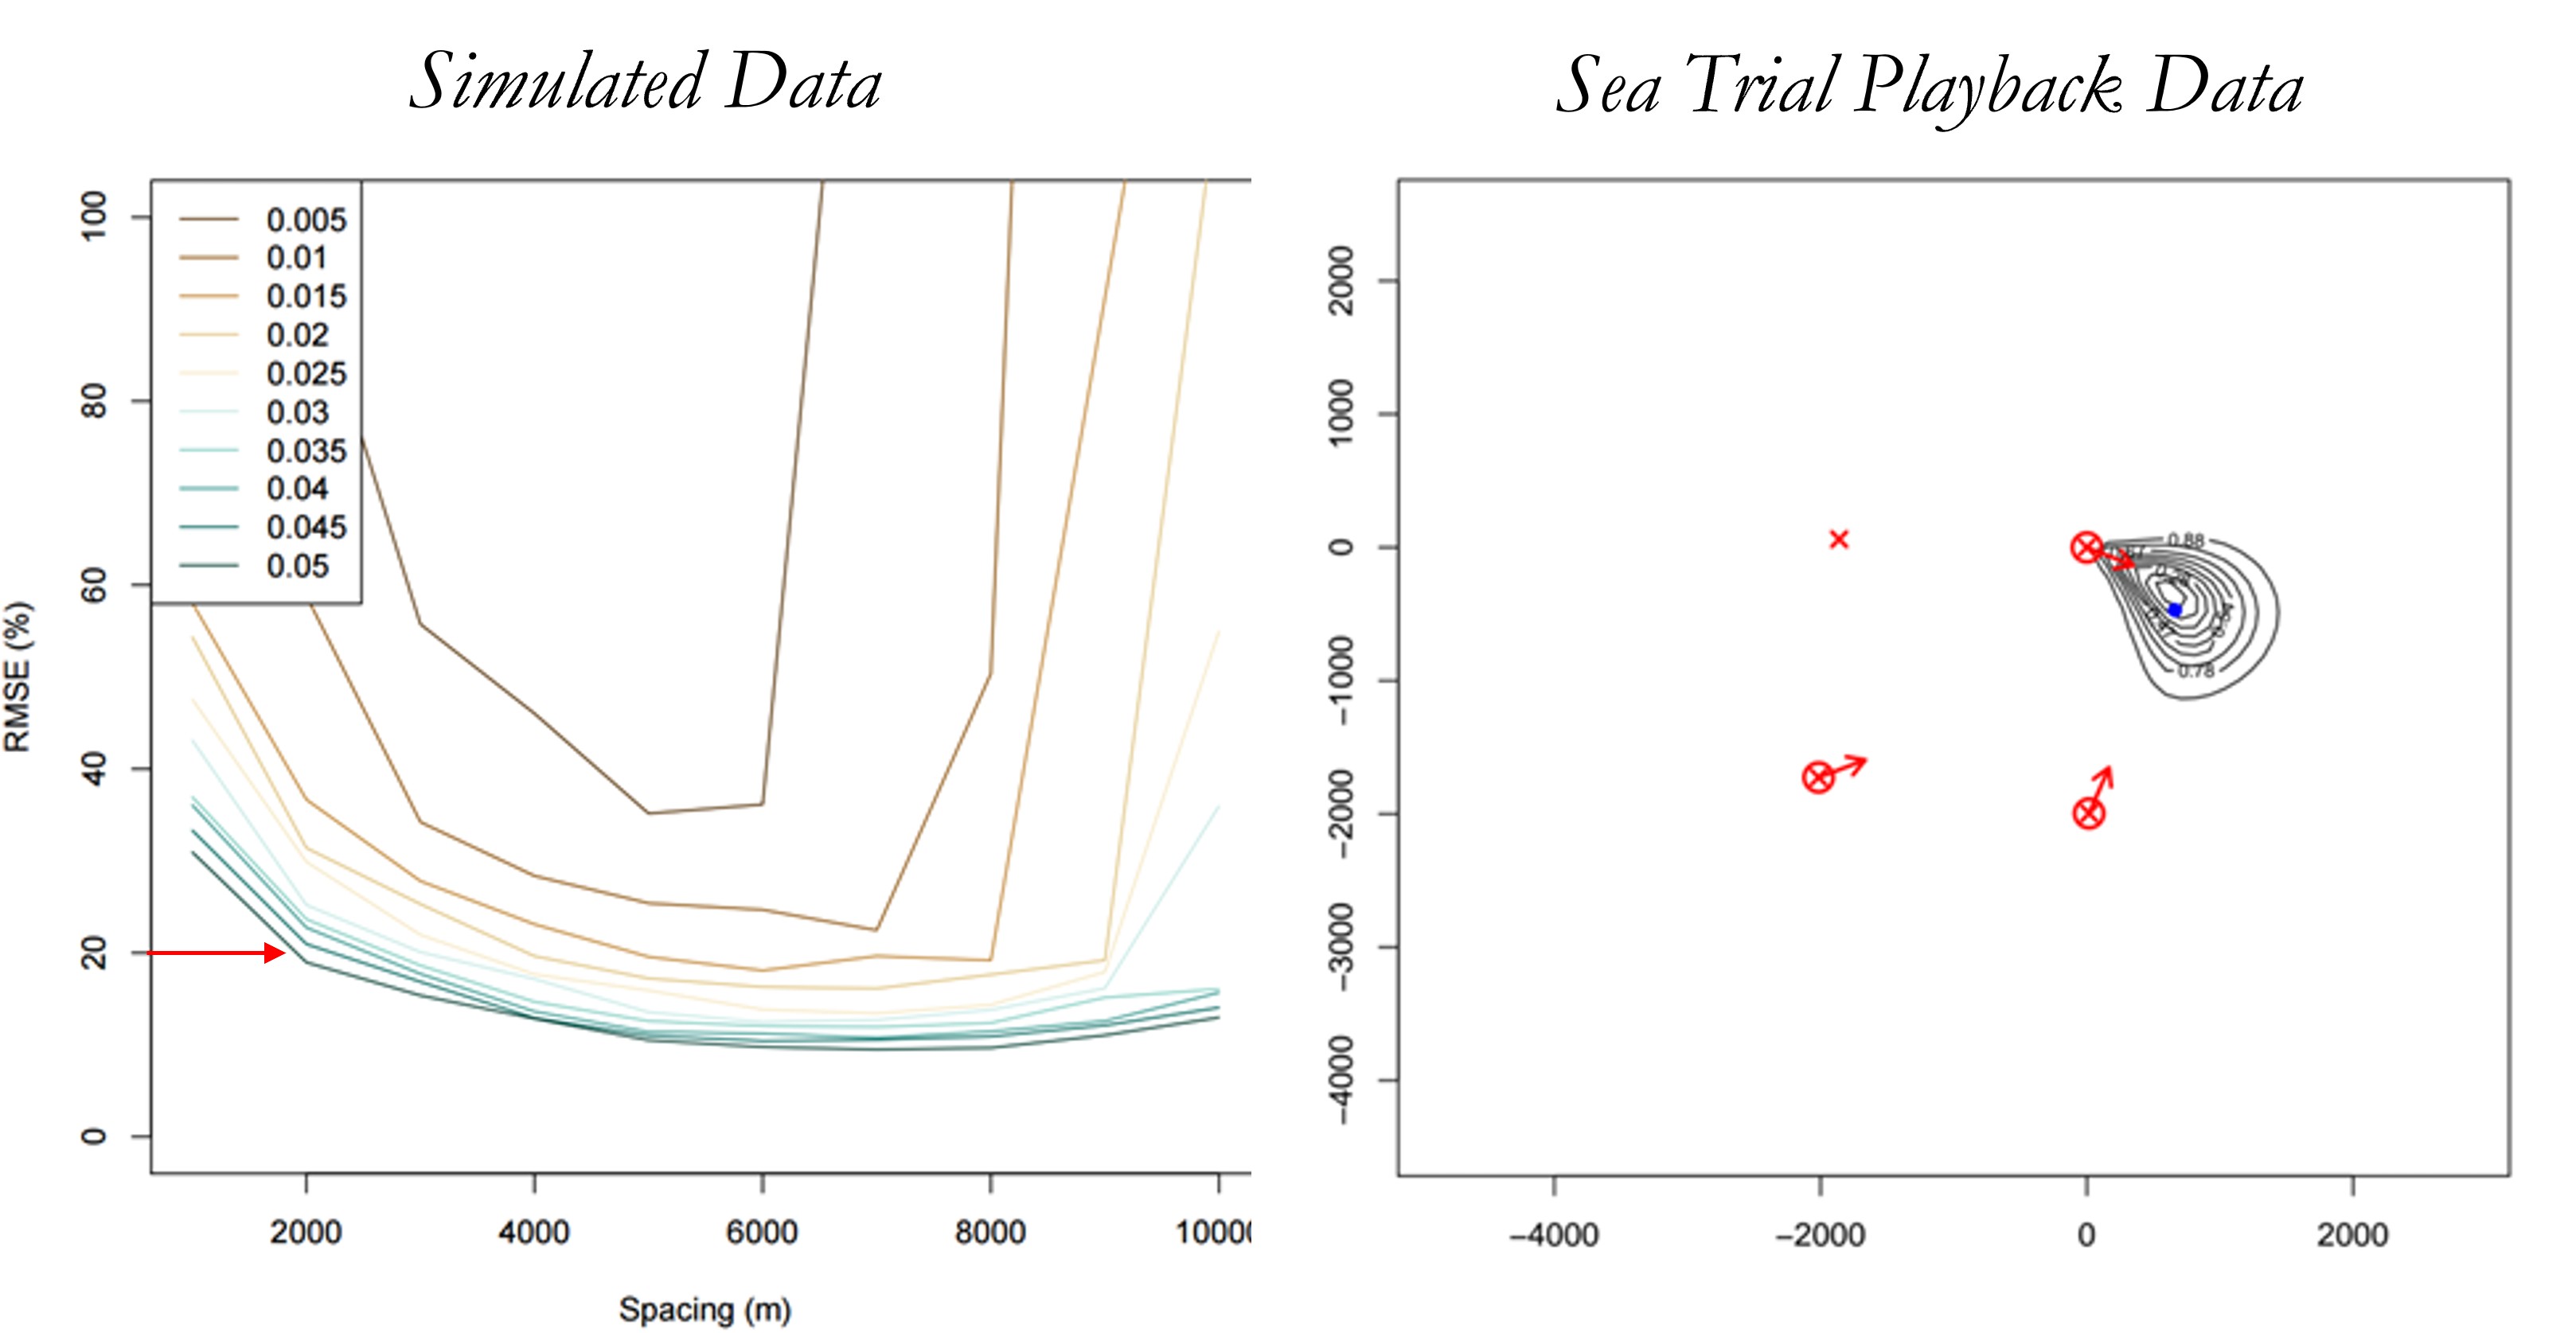
SWFSC collaborated with Ben Stevenson (University of Aukland) to evaluate the potential use of Acoustic Spatial Capture Recapture (ASCR) methods to estimate call density across clustered sonobuoys. While a simulation suggested these methods should be feasible, application to real data identified a number of complications and errors that precluded adoption of ASCR for these cases. Links to summaries of the sonobuoy SCR models and application to real data.
Azigram Displays for DIFAR Sonobuoys
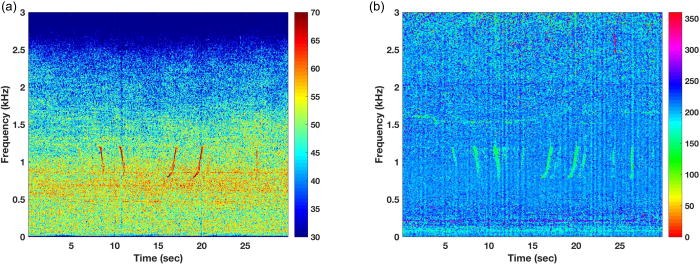
As part of a larger methods paper led by Aaron Thode (Scripps Institution of Oceanography), this playback data provided a means of testing the capabilities of using Azigrams to enhance the accuracy of bearing measurements of weak frequency-modulated signals. See Thode et al. 2019 for more information.
Estimating Sonobuoy Drift
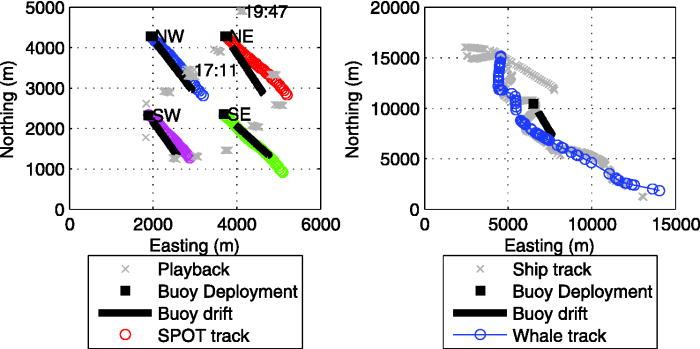
We attached GPS to each of the four sonobuoys during the playback experiment, which provided high resolution tracking. This data provided a valuable dataset to test new methods for estimating sonobuoy drift developed by Brian Miller of the Australian Marine Mammal Center. See Miller et al. 2018 for more information.