Metadata and Tracking
We used three platforms for tracking our buoys: (1) Lonestar Tracking and (2) Find Me Spot, and (3) Driftwatch.
Lonestar Tracking
Lonestar Tracking is an online tracking platform provided by our satellite tracking provider for our SmartOne Solar GPS units. This platform provides updates on previous and current positions of our pole buoys. Each GPS has it’s own track. The tracks can only be displayed one at a time on the website.
*Contact Shannon Rankin (shannon.rankin@noaa.gov) if you require login information.
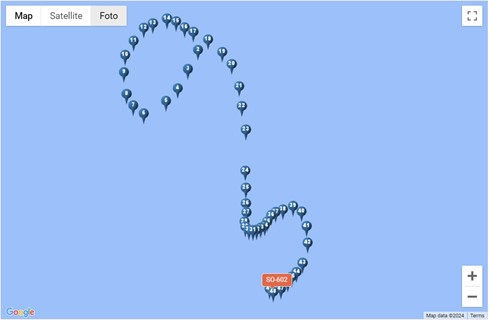
Find Me Spot
Find Me Spot is an online tracking platform provided by our other satellite tracking provider for our Spot GPS units. This platform provides updates on the most recent position of our PIFSC buoys.
![]()
Driftwatch
DriftWatch was developed by our team (Taiki Sakai) to help us track our buoys. Ocean currents can be unpredictable, so having a near-real-time tool to keep track of buoy positions is very useful. DriftWatch automatically downloads GPS data for each buoy, and creates plots of their drift tracks with the ocean currents every hour. These get uploaded to a Google Drive folder so that it is easy for anyone to access them.
Driftwatch currently consists of 3 functions:
Drift Maps. Maps of current deployments, updated hourly
Test Deployments. Allows user to create a map of potential deployment locations overlaid on ocean currents
Text Location Updates. Sends text message updates on buoy location to aid retrieval.
Drift Maps
Maps will automatically be made for any deployments that DriftWatch knows about. To add a new deployment, you need to fill in information in the NEW DEPLOYMENT TO SAVE tab of the Deployment Details worksheet. The important fields for DriftWatch are:
Deployment_Date_UTC - The date of deployment. This is when DriftWatch will start creating maps. This can just be a date initially, but should eventually be updated to an accurate deployment time.
Data_Start_UTC - To be filled in later, the start of usable data on the recording.
Recovery_Date_UTC - The date of recovery. This is when DriftWatch will stop creating maps. This can just be a date initially, but should eventually be updated to an accurate deployment time.
Data_End_UTC - To be filled in later, the end of usable data on the recording.
GPS ID - The ID(s) for the trackers attached to this deployment. Should be letters for SPOT devices, or SO-### for solar devices. If multiple trackers are used, they should be separated by a /
Project - Project name, e.g ADRIFT
DeploymentID - Deployment number for this project
Site - Optional, a 3 letter code for the deployment site. Should be one of the options on the “Site List” tab of the worksheet
Once these are filled in, DriftWatch will add this drift to its known deployments the next time it runs, and maps will be made. The remainder of the fields are not used by DriftWatch, but should be filled in if you have the information.
Plots are uploaded to the “DriftPlots” folder every hour, and are named according to the following naming scheme:
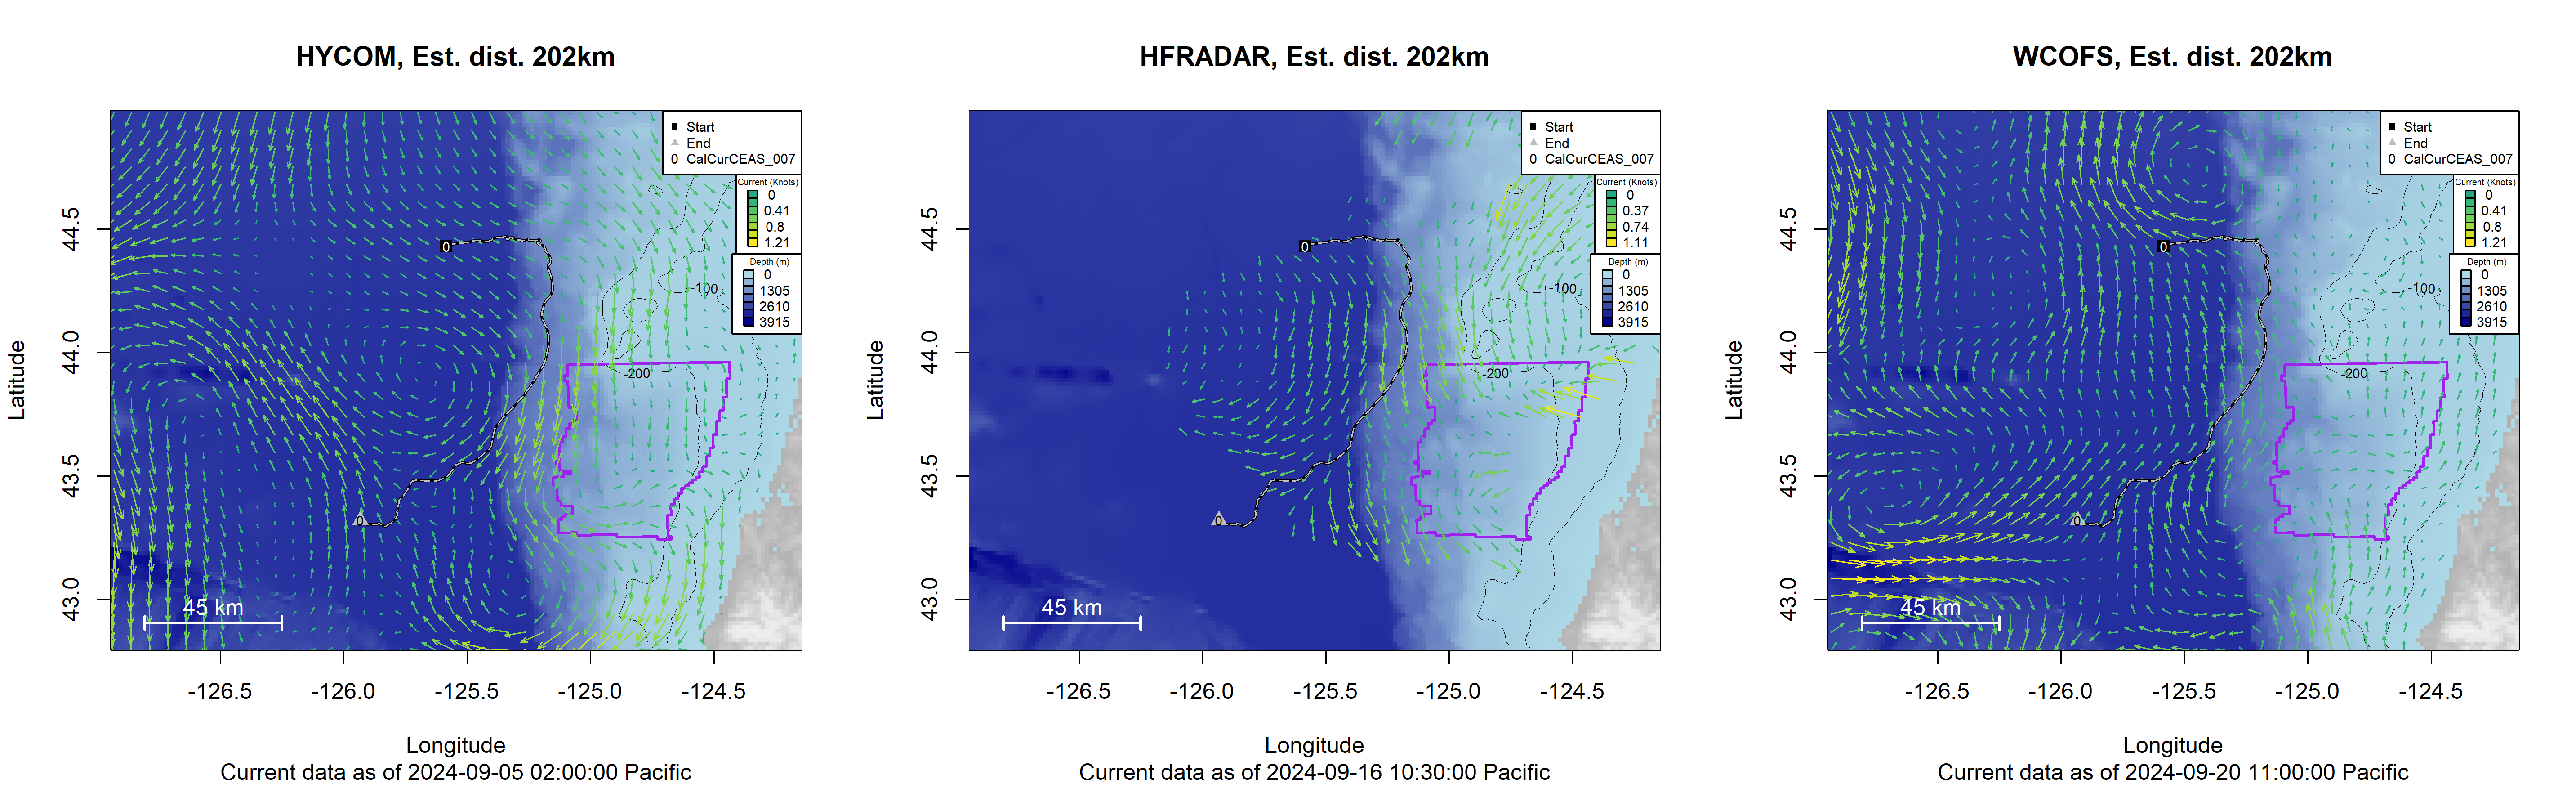
The “Current” being displayed is from either Hybrid Coordinate Ocean Model (HYCOM), High Frequency Radar (HFRADAR), or West Coast Operational Forecast System (WCOFS) depending on which source of ocean current data is being used. DriftWatch will always try to make a plot using all three, but occasionally it can run into errors trying to download the data so you may only see one. HYCOM data have excellent coverage everywhere, but the major downside is that they are only updated once a day, typically in the morning. This means that the current picture may not look accurate later in the day. HFRADAR is updated much more frequently, but there are many areas that do not have any coverage for HFRADAR, so your plot may not show any data. Additionally, the HFRADAR data source has been much more finicky, and can often be unavailable for download. WCOFS provides predictions of the astronomical tide up to four times per day, but cannot predict current changes due to wind, atmospheric pressure, and river flow. All plots show the last time the current data was updated at the bottom.