Tracking
We use two platforms for tracking our solar GPS trackers: (1) Lonestar Tracking and (2) Driftwatch.
Lonestar Tracking
Lonestar Tracking (https://fleetone.lonestartracking.com) is an online tracking platform provided by our satellite tracking provider. This platform provides updates on the most recent position updates (and time since last position update) for all devices in our inventory.
Contact Shannon Rankin (shannon.rankin@noaa.gov) if you require login information.
Driftwatch
DriftWatch was developed by our team (Taiki Sakai) to help us track our buoys. Ocean currents can be unpredictable, so having a near-real-time tool to keep track of buoy positions is very useful. DriftWatch automatically downloads GPS data for each buoy, and creates plots of their drift tracks with the ocean currents every hour. These get uploaded to a Google Drive folder so that it is easy for anyone to access them.
Driftwatch currently consists of 3 functions:
Drift Maps. Maps of current deployments, updated hourly
Test Deployments. Allows user to create a map of potential deployment locations overlaid on ocean currents
Text Location Updates. Sends text message updates on buoy location to aid retrieval.
Drift Maps
Maps will automatically be made for any deployments that DriftWatch knows about. To add a new deployment, you need to fill in information in the NEW DEPLOYMENT TO SAVE tab of the Deployment Details worksheet. The important fields for DriftWatch are:
- Deployment_Date_UTC - The date of deployment. This is when DriftWatch will start creating maps. This can just be a date initially, but should eventually be updated to an accurate deployment time.
- Data_Start_UTC - To be filled in later, the start of usable data on the recording.
- Recovery_Date_UTC - The date of recovery. This is when DriftWatch will stop creating maps. This can just be a date initially, but should eventually be updated to an accurate deployment time.
- Data_End_UTC - To be filled in later, the end of usable data on the recording.
- GPS ID - The ID(s) for the trackers attached to this deployment. Should be letters for SPOT devices, or SO-### for solar devices. If multiple trackers are used, they should be separated by a /
- Project - Project name, e.g ADRIFT
- DeploymentID - Deployment number for this project
- Site - Optional, a 3 letter code for the deployment site. Should be one of the options on the “Site List” tab of the worksheet
Once these are filled in, DriftWatch will add this drift to its known deployments the next time it runs, and maps will be made. The remainder of the fields are not used by DriftWatch, but should be filled in if you have the information.
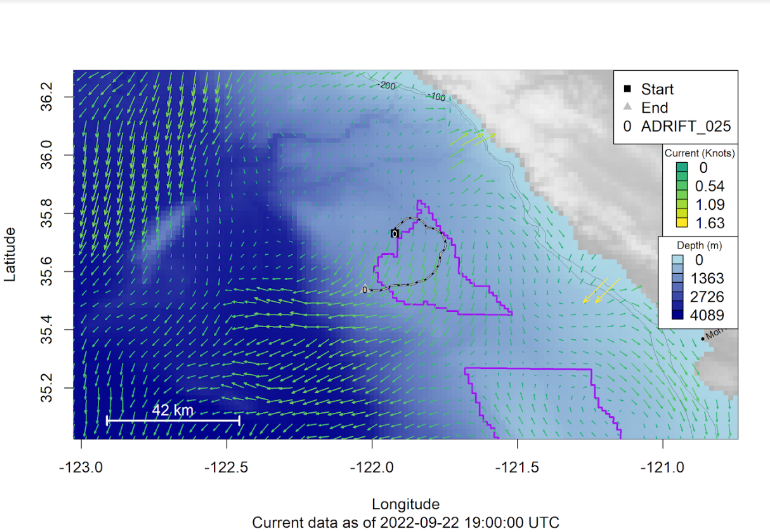
Plots are uploaded to the “DriftPlots” folder every hour, and are named according to the following naming scheme:
Project_DeploymentID_Current_DeployDate_Site.png
“Current” is either HYCOM or HFRADAR depending on which source of ocean current data is being used. DriftWatch will always try to make a plot using both, but occasionally it can run into errors trying to download the data so you may only see one. HYCOM data have excellent coverage everywhere, but the major downside is that they are only updated once a day, typically in the morning. This means that the current picture may not look accurate later in the day. HFRADAR is updated much more frequently, but there are many areas that do not have any coverage for HFRADAR, so your plot may not show any data. Additionally, the HFRADAR data source has been much more finicky, and can often be unavailable for download. All plots show the last time the current data was updated at the bottom.
GPS CSV Files
DriftWatch will also create CSV files of the coordinates for any completed drifts. These are stored in the GPS_CSV folder within the main DriftWatch folder, each file is named with DriftName_GPS.csv. Each CSV file is also paired with a map showing the extent of the drift stored in the CSV, the purpose of these is to give a quick visual check of the track to make sure no extra data points are being stored. If the deployment start or recovery dates have not been updated, it is likely that there are a number of coordinates included that are not actually part of the drift but part of the boat track. These should be easy to see within the map, so before using any CSV files you should check the map for any obvious issues. These GPS CSVs also have some quality checks applied to try and remove any incorrect GPS points, or any obvious boat track portions. This works by removing any coordinates where the average speed between points is greater than 4 knots. The CSV files also contain two additional columns other than the coordinates and UTC times:
- knots- the average speed between consecutive points. Note that if multiple GPS devices are used on a single drift, then this speed value is only calculated between points from the same device.
- recordingEffort - a TRUE/FALSE column marking where recording effort is on, defined by the DataStart and DataEnd columns in the deploymentDetails worksheet. If these have not been filled in, then the entire column will be FALSE.
If you notice that one of the GPS tracks has incorrect start or end times (obvious boat track included in the image), then the most likely cause is that the Deployment or Recovery times are still listed as just dates in the deploymentDetails, and need to be updated to an accurate Date Time. Once this has been done, then you can trigger a new version of the CSV to be created by deleting it within the GPS_CSV folder. If there are still issues with the GPS then contact Taiki Sakai (taiki.sakai@noaa.gov) and he will adjust it manually.
Test Deployments
There is a Google Sheet within the main DriftWatch folder called “TestDeployments” that lets you create plots of the currents at specific locations. The main idea for this is to keep an eye on the currents of potential deployment sites, since deploying into a strong offshore current can lead to big problems. This worksheet contains the following columns:
- Latitude/Longitude - The coordinates to create the plot. A marker will be left at these coordinates, and the map will be centered here
- Name - A name for this test deployment, should be unique from other deployments. If you want to draw multiple points on the same plot, then you can give multiple points the same name
- DeploymentSite - Optional, only used for labeling. Same as DeploymentSite in regular plots
- LatRange/LonRange - Optional, lets you control the displayed range of the plot. Can either be given as min, max separated by a comma, or if it is a single value then this defines how far to extend the bounds in each direction from the drawn point. For example, if a point is at a Latitude of 32, then LatRange of 31, 33 OR LatRange of 1 will both give the same result.
- PlotEndDate - Optional (but highly recommended) - This tells DriftWatch when it can stop creating the plots. The plot upload process is quite slow, so if there are too many plots the whole process takes quite a while. So if you want to keep an eye on a location for a potential deployment on October 20th, then setting an end date of 10/21/2022 would be ideal.
- Note - Optional, used only for your personal use. Some rows also contain notes with reminders for how to use this spreadsheet.
These plots get created every hour, at the same time as the regular plots. They get uploaded to the “TestDeploymentPlots” folder.
Text Updates
This is a very beta feature that has been somewhat unreliable, but when it is working it can send updates of the most recent location of buoys to an email address or as a test message to a cell phone or satellite phone. This is to make sure that people on the boat retrieving buoys can have easy access to the most up-to-date locations to make the process go smoothly.
Setup requires filling out information in the TextUpdates worksheet. The “Schedule” tab contains the following columns:
- Start_Local - Time to start sending text messages (local / PDT). Date format must be YYYY-MM-DD HH:MM:SS
- End_Local - Time to stop sending text messages (local / PDT). Date format must be YYYY-MM-DD HH:MM:SS
- Deployment_Name - The name of the drift you want updates for, must exactly match the name of the drift (e.g. ADRIFT_004 not ADRIFT_4). If you want updates on multiple buoys they must be on separate lines
- Recipient_Id - The ID number for who should receive the messages, from the “Contacts” tab. If multiple people want messages, they must be on different rows.
- Coord_Style - Tag specifying formatting style for coordinates. One of dms, deciminute, or decidegree corresponding to 32°24’54”, 32°24.9’, or 32.415
- Note - Contains reminders, otherwise for personal use
Also fill out the “Contacts” tab with the following columns
- Id - The ID number you refer to from the “Schedule” tab
- Name - Name of person receiving message
- Number - Phone number
- Provider - Cell service provider. Used to lookup the proper extension for sending text as email
- Extension - Sending a text via e-mail is done by sending an email to PHONENUMBER@EXTENSION where the extension depends on the cell service provider. If you aren’t sure how to find this, let me know and I can look it up for you
- Email - The combination of the number and extension. Alternatively if you only want an e-mail and not text messages, you can put that here. This is the important field that actually gets read by DriftWatch
- Notes - Contains instructs and personal notes
Messages are sent out every 30 minutes, at approximately XX:10 and XX:40. The message will contain the most recent coordinates for the drift selected, as well as an approximate heading and speed (knots) calculated using the last two GPS points. The message will also list the time of the last update (local / PDT), so users can tell if it has been a long time since the last update and use the speed/heading to estimate a potential current location.
We currently are only allowed 200 messages per day, so please limit the number of people receiving messages! Estimate how many you will be sending per day (2 per hour per drift per person) to make sure you fall within this limit, and set your start / end times sensibly.
This is currently in very beta mode, and is still being tested. Some users have been able to receive test messages prior to fieldwork, but then no messages were received while out. Other users have not been able to receive messages at all. Please test before you plan on using it, reach out if you need help.