Sperm Whales
Methods Summary
Triton software is used for the following:
Acoustic data from Channel 1 is decimated to 48 kHz sample rate
Long-term spectral averages (LTSAs) are calculated with a 100 Hz, 5 second resolution
The start and end times of sperm whale echolocation clicks are identified by manually scanning LTSAs in 1 hour windows
Identify periods of vessel noise or buoy self-noise which could mask sperm whale echolocation
Step-by-Step Instructions
Decimation of acoustic data
Most ADRIFT acoustic data is recorded at sampling rates of 384 kHz, however sperm whale echolocation clicks contain energy between 400 Hz to 30 kHz. To reduce processing time and data storage requirements, full bandwidth data is decimated to a sample rate of 48 kHz using a decimation factor of 8 (384,000/48,000=8).
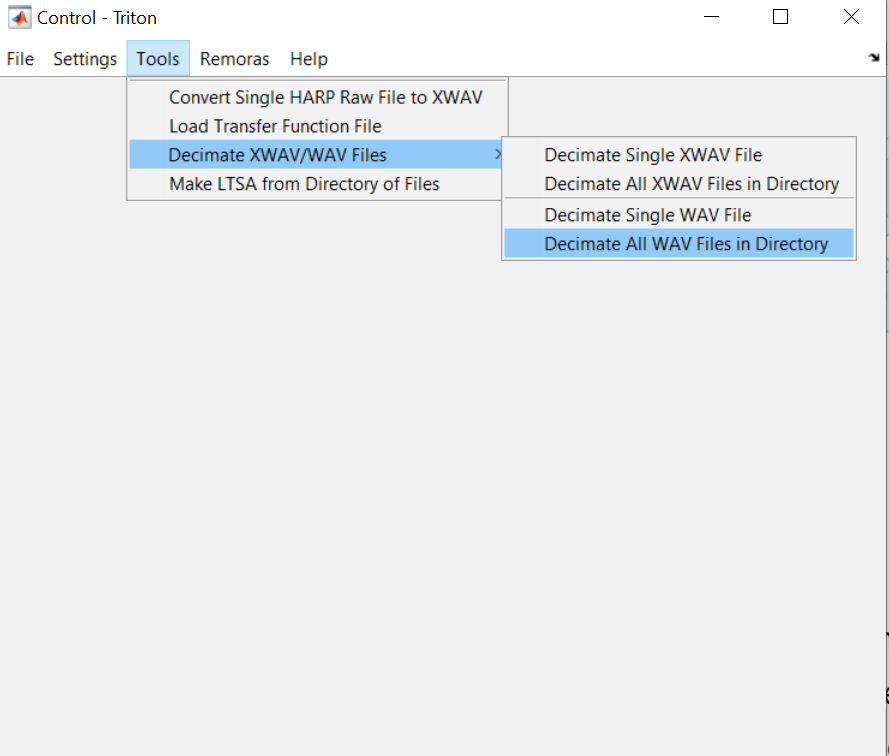
In the Triton “Control” window, select the Tools menu and choose to “Decimate All WAV Files in Directory”

You will be prompted to choose a folder of WAV files, and then define the appropriate decimation factor. For example, to decimate from 384 kHz to 48 kHz, use a decimation factor of 8.
Then define a folder to save the new, decimated WAV files.
The decimation process will start automatically and show a progress bar. When the decimation is complete, the progress bar will disappear. Depending on the total number of files and the required decimation factor, this process may take a few hours.
Generate Long Term Spectral Average (LTSA)
See methods in “Data Prep” section. Use 5 s 200 Hz resolution.
Manually log sperm whale acoustic events
Start Triton Logger remora
Launch Triton within Matlab. Open the LTSA for the data you want to analyze.
In the Triton “Control” window, select the Remoras menu, choose Logger and then start a new log. You will to re-start Triton if this is the first instance of using the Logger remora. See more info on Triton Remoras on the Marine Bioacoustic Research wiki.
Log start and end times of sperm whale acoustic events
Sperm whales (Physeter macrocephalus) produce echolocation clicks which can be easily identified by their distinct frequency content and high amplitude signal observable in the LTSA and spectrogram (Worthington and Schevill 1957; Watkins and Schevill 1977; Goold 1999;, B. Møhl et al. 2000; Bertel Møhl et al. 2003; Madsen, Wahlberg, and Møhl 2002).
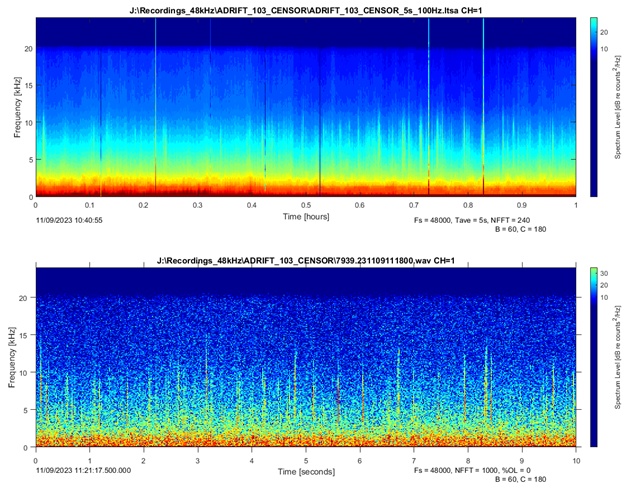
A trained analyst viewed 1 h windows of long-term spectral averages (LTSA; Wiggins and Hildebrand (2007); 5 s time average, 100 Hz frequency bins). Once sperm whale clicks were identified in the LTSA, 10 s spectrograms were used to confirm species identification (Figure 1). LTSAs and spectrograms were scanned with a brightness of 60 and a contrast of 180 for consistency across deployments. An encounter was defined as a series of clicks separated by no more than 30 min from other clicks. This time frame was chosen to match the typical echolocation production time during an average sperm whale dive cycle (Watwood et al. 2006). The start and end times of all encounters were noted, and these start and end times were used for further analysis.
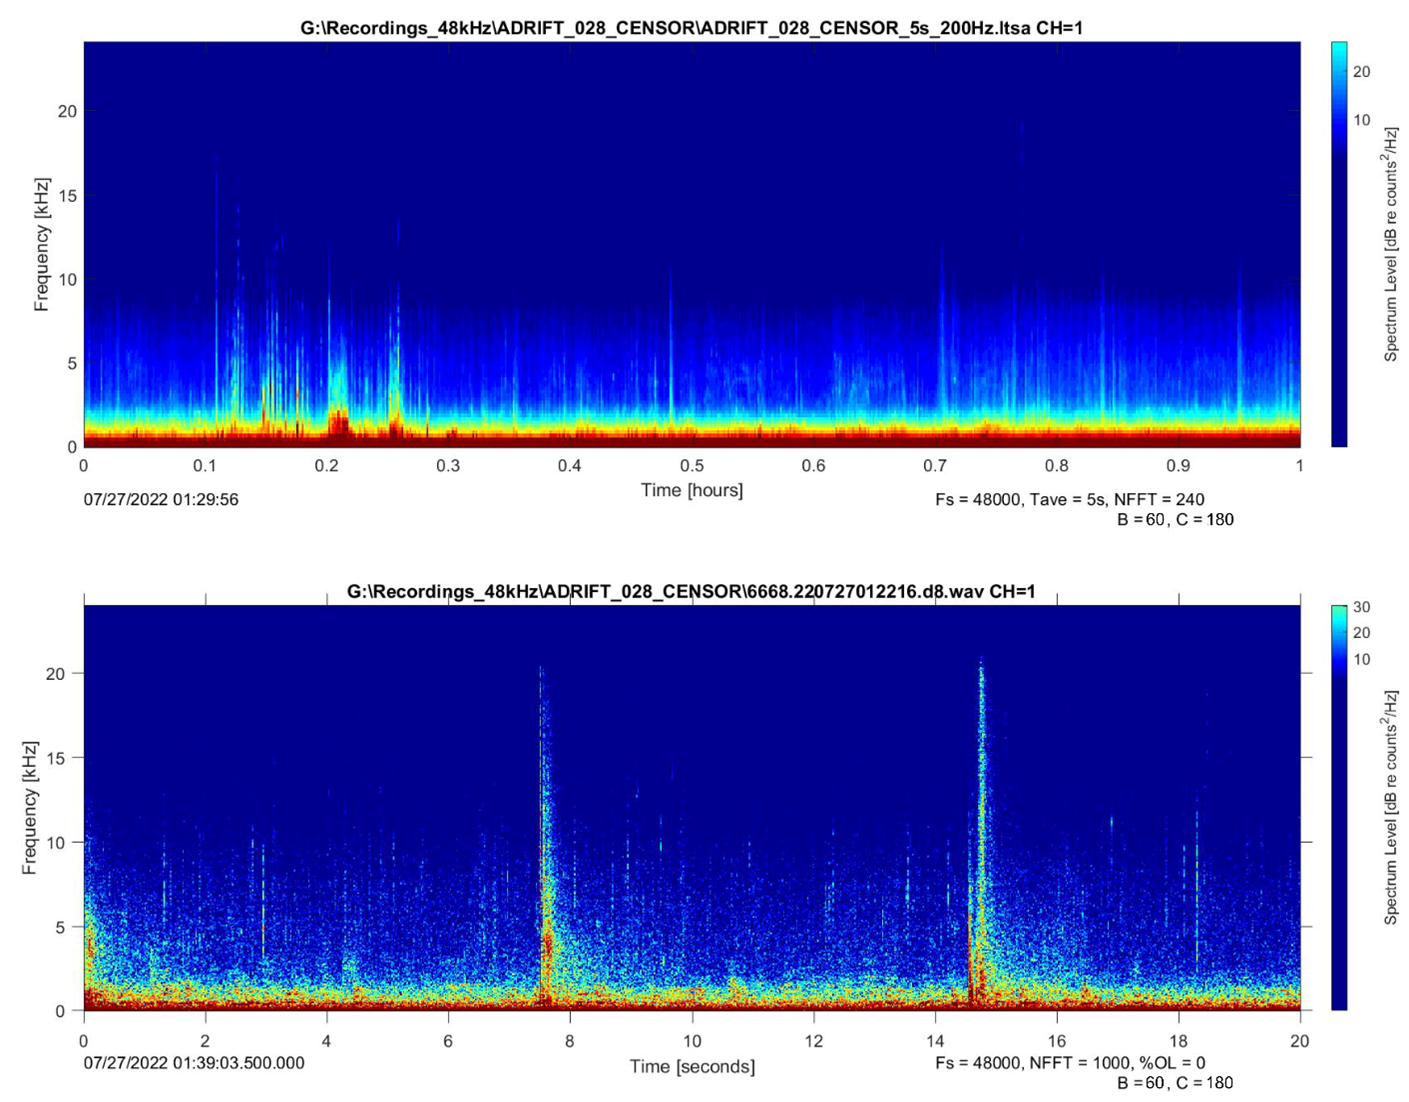
Opportunistic detections of slow clicks were also logged. These clicks have longer interclick intervals, a lower frequency emphasis around 2-4 kHz, and a longer duration (Figure 2) (Mullins, Whitehead, and Weilgart 1988; Weilgart and Whitehead 1988; Jaquet, Dawson, and Douglas 2001; Madsen, Wahlberg, and Møhl 2002).
We assumed no signals were mistaken for sperm whales because all LTSA detections were visually verified. We also assumed negligible missed detections given the characteristics of sperm whale echolocation clicks that make them easy to distinguish from other odontocete species, particularly their frequency content.


Identify potential masking for sperm whale echolocation
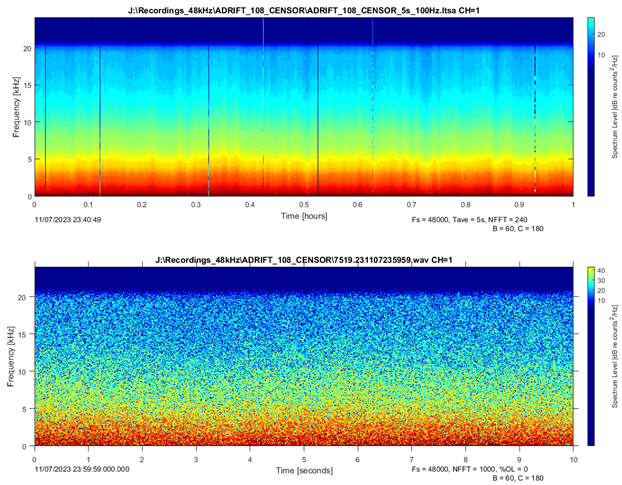
Sperm whale clicks can be masked by the impulsive signals from ship propeller cavitation or high amplitude ambient noise (rain, wind, etc.). Times with ship or ambient noise that masked any potential sperm whale clicks were considered times with no effort since analysts were unable to determine sperm whale presence (Figure 3). Ships were logged as either being broadband or narrowband/low frequency (see details of ship logging in soundscape methods for more details). Narrowband/low frequency ships were fainter and did not mask sperm whale detections and were considered times with logging effort.

##Add sub-section about IPI/ICI analysis (not useful for duty-cycled data; Could be useful to apply on continuous data)