Marine Mammal Detections
A primary goal of the Adrift-ACCESS project was to identify which marine mammal species frequent the Greater Farallones and Cordell Bank National Marine Sanctuaries, and to describe their seasonal occurrence and distribution within the greater California Current Ecosystem. Different call types are understood to be associated with specific behaviors and therefore provide information related to habitat use. Passive acoustic monitoring relies on sounds produced by animals for detection, and therefore PAM studies cannot identify the absence of animals.
Sperm Whales
Sperm whales were detected during ACCESS surveys in all months except late September/early October Figure 1. Most sperm whale detections were ‘regular’ clicks associated with feeding animals; ‘slow’ clicks (associated with adult males) were uncommon but detected in all regions except Morro Bay (Table 1).
Sperm whales had been documented only 3 times in the waters offshore San Francisco in over 30 years of ACCESS visual surveys (J. Roletto, pers. comm.). Our detection of sperm whales (both regular and slow clicks) from drifting recorders deployed during the ACCESS surveys suggests that passive acoustic monitoring might improve our understanding of sperm whale distribution in the busy shipping lanes off San Francisco as well as within the combined Greater Farallones and Cordell Bank National Marine Sanctuary.
| Upwelling | Post-Upwelling | Winter | |
|---|---|---|---|
| Regular Clicks | 0.03 (769) | 0.00 (626) | – |
| Slow Clicks | 0.01 (769) | 0.00 (626) | – |
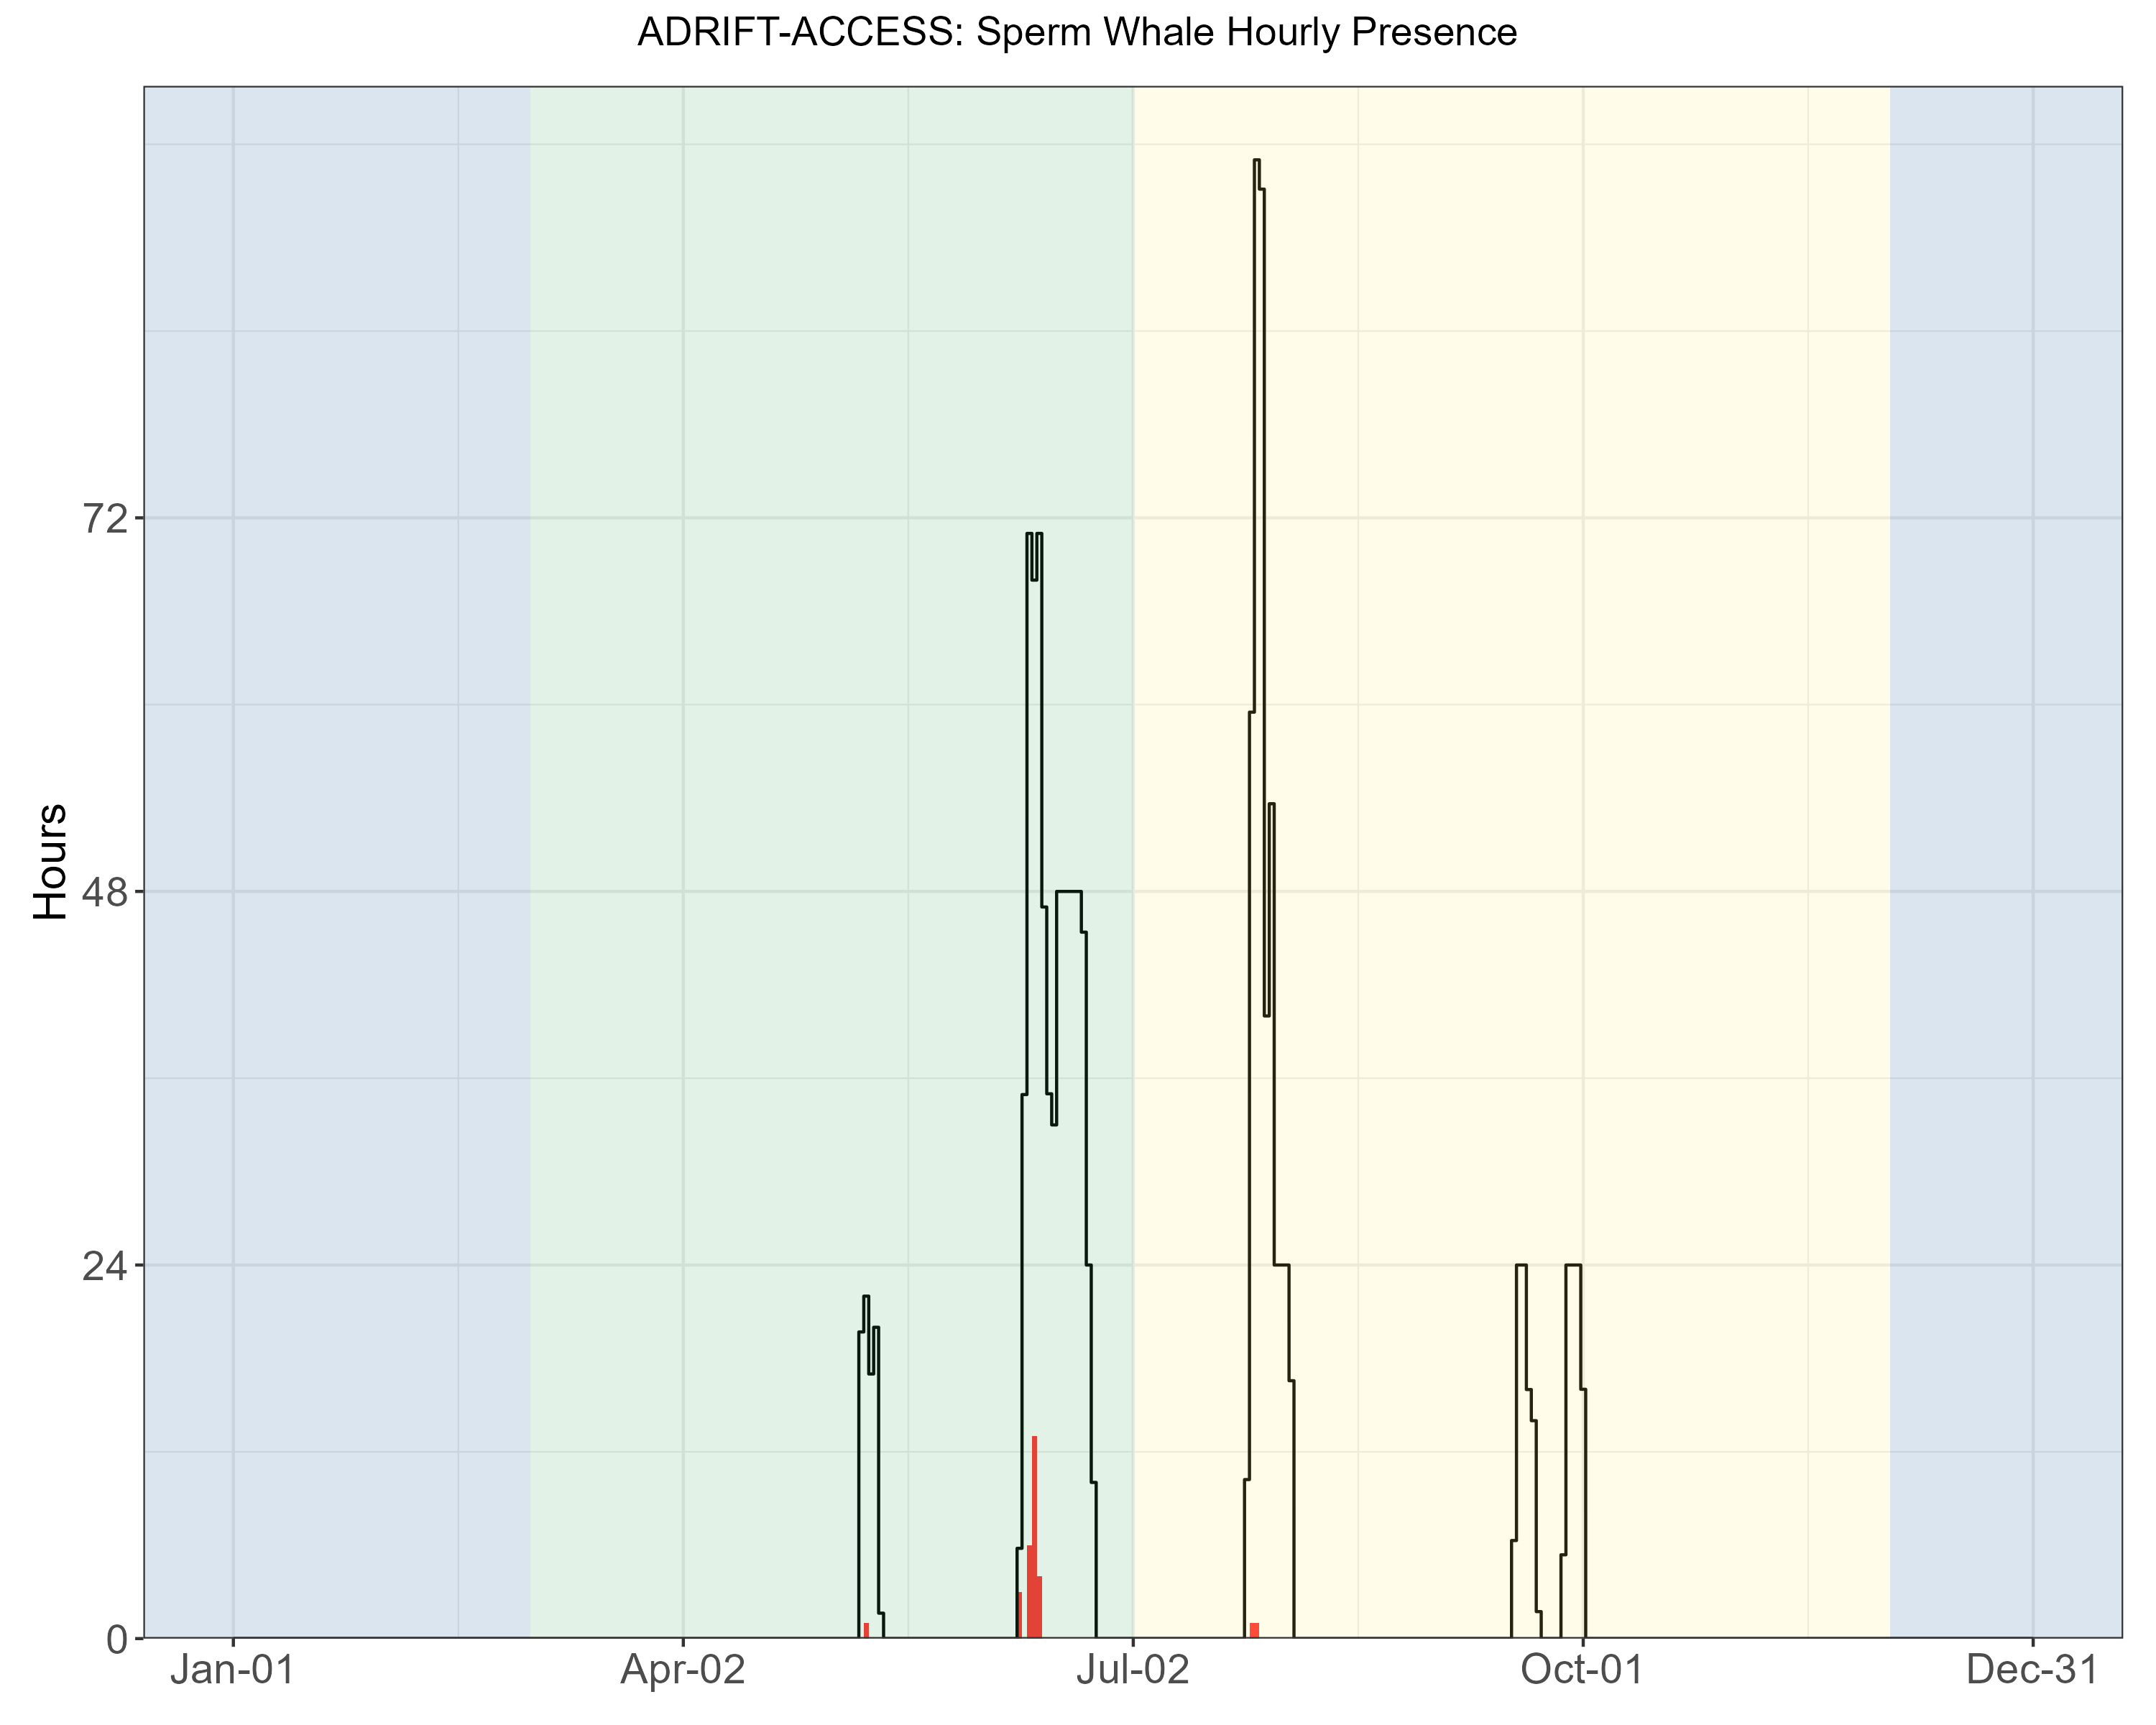
A pilot study examining the potential estimation of body size based on inter-pulse and inter-click intervals found that sperm whale groups detected during November deployments in Morro Bay were comprised of females and juvenile males (see online summary: Sperm Whale Demographics).
Beaked Whales
Baird’s beaked whales and goose-beaked whales were detected in recordings collected during the Adrift-ACCESS surveys (Table 2, Figure 2). Detections of both species were higher during the post-upwelling season, and goose-beaked whales were more commonly detected than Baird’s beaked whales (Table 2).
| Upwelling | Post-Upwelling | Winter | |
|---|---|---|---|
| Baird’s beaked whale | 0.0031 (960) | 0.0176 (688) | – |
| Goose-beaked whale | 0.0147 (960) | 0.0250 (688) | – |
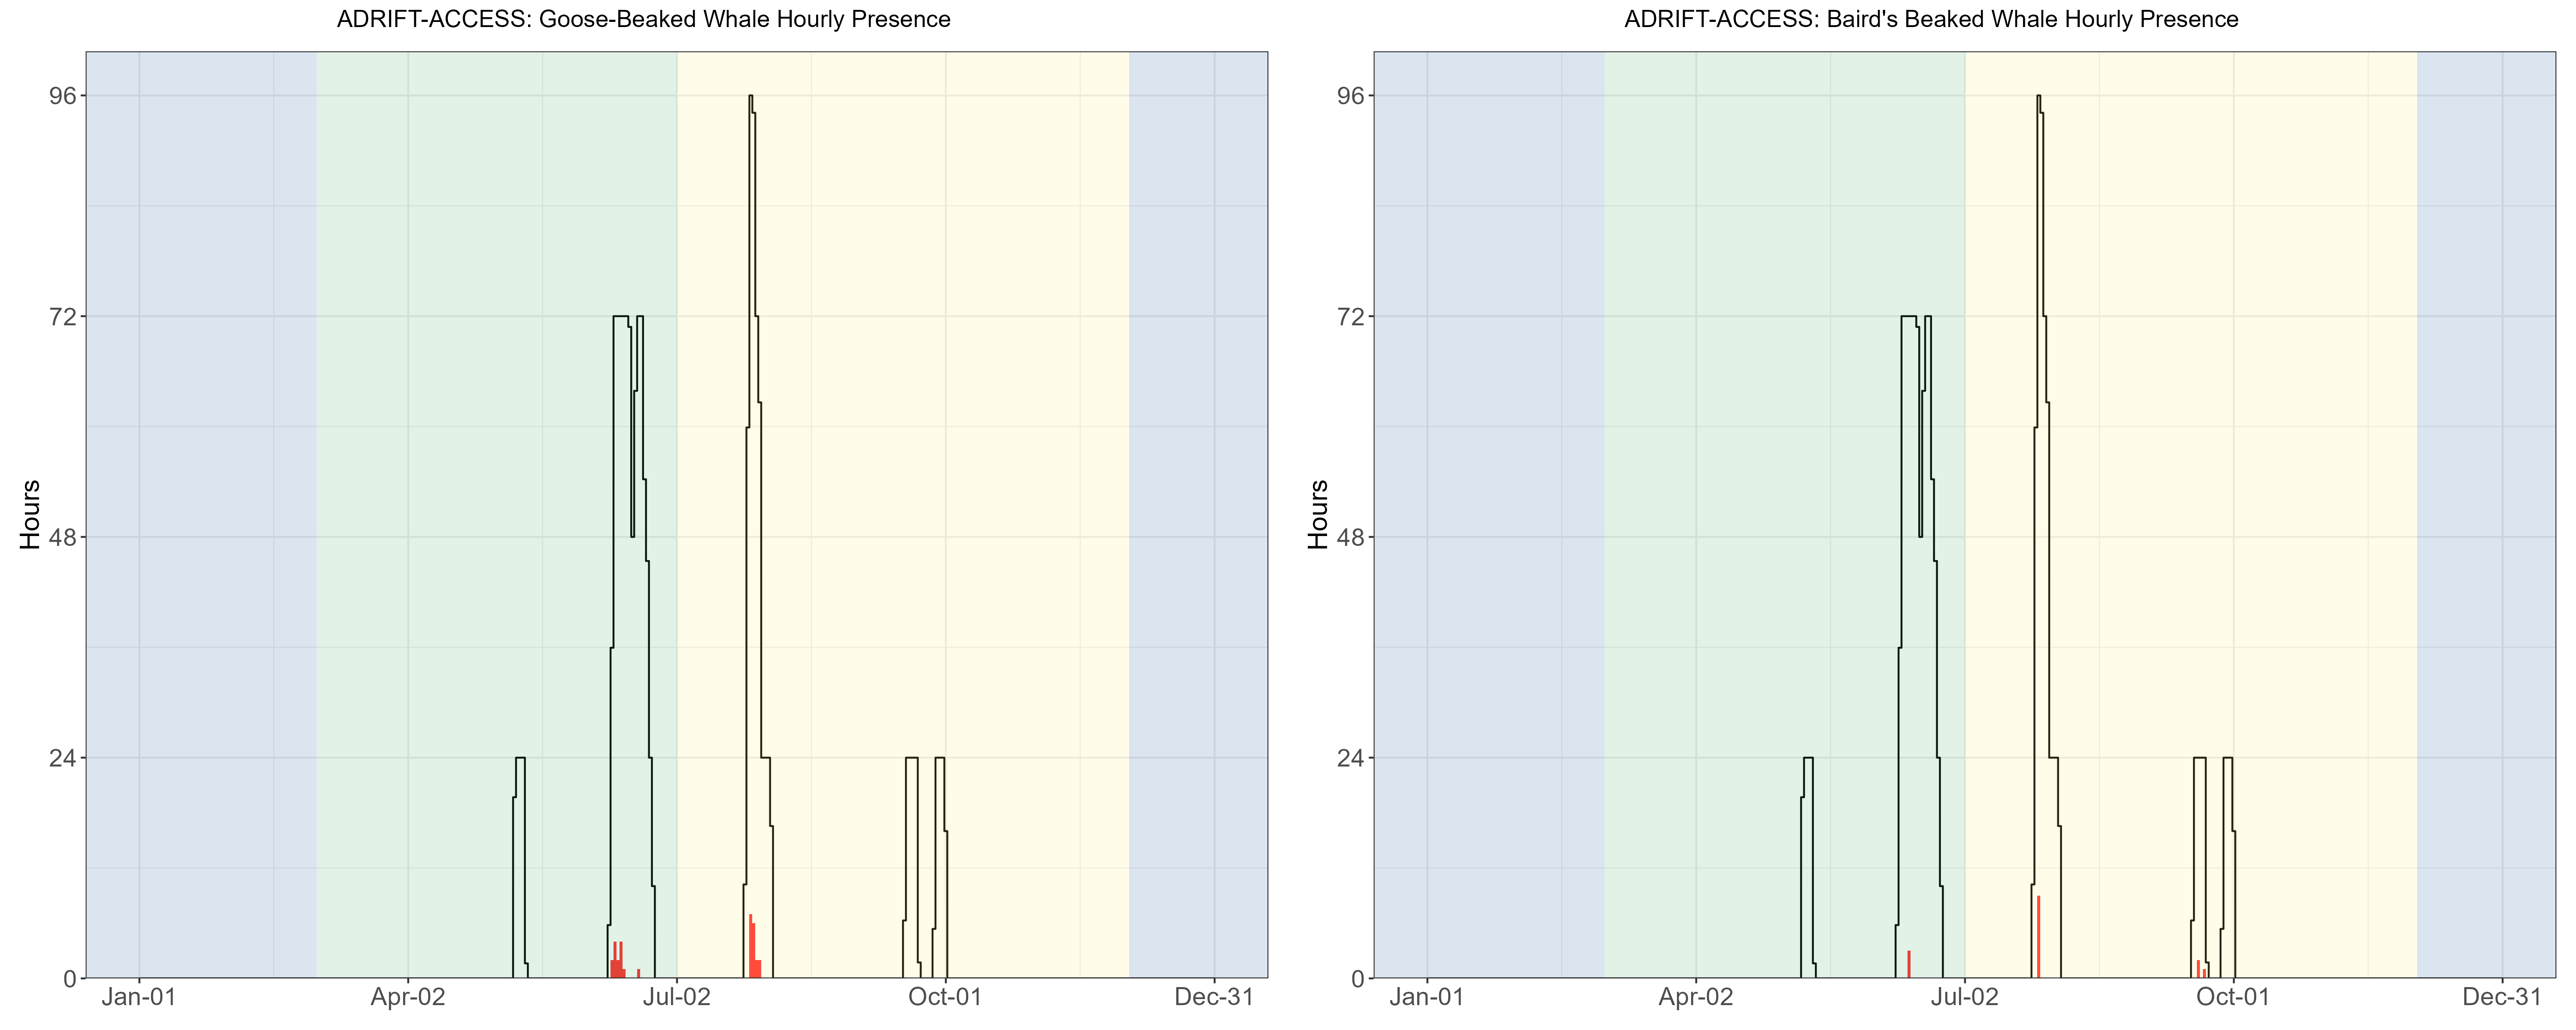
There had been no visual detection of beaked whales during the 30 years of annual ACCESS surveys offshore San Francisco (J. Roletto, pers. comm.). The drifting recorders deployed during the ACCESS surveys detected both Baird’s and goose-beaked whales, suggesting that beaked whales do occur in and near the shipping lanes and the combined Greater Farallones and Cordell Bank National Marine Sanctuaries. The discrepancy in these detections is likely due to the typically poor sighting conditions in this region and the cryptic surfacing behavior of beaked whales. Future surveys in this region should consider passive acoustic monitoring with sufficient bandwidth to detect echolocating beaked whales.
Dolphins
Dolphins were detected during all Adrift-ACCESS deployments (Figure 3). Dolphin events included detections that could be positively attributed to Risso’s dolphins and Pacific white-sided Dolphins, and detections that remained unidentified (Table 3).
| Upwelling | Post-Upwelling | Winter | |
|---|---|---|---|
| Risso’s dolphins | 0.01 (960) | 0.01 (688) | – |
| Pacific white-sided dolphins | 0.10 (960) | 0.23 (688) | – |
| Unidentified dolphins | 0.00 (960) | 0.00 (688 | – |
There were no dolphin events that did not include at least Risso’s or Pacific white-sided dolphins (Table 3). Pacific white-sided dolphins were detected at higher rates than Risso’s dolphins in all but the earliest survey during the upwelling season Figure 3. Dolphin schools in central and northern California are frequently encountered in large, dispersed mixed species groups (S.Rankin, pers. comm.), and here we do not distinguish mixed species from single-species groups. So, attribution of an acoustic event to Risso’s dolphins does not preclude the presence of other species. We currently lack a comprehensive acoustic classification routine that includes all dolphin schools in the region. Future research should develop a publicly available acoustic classifier for dolphins that considers mixed species groups and can be applied to different passive acoustic platforms.
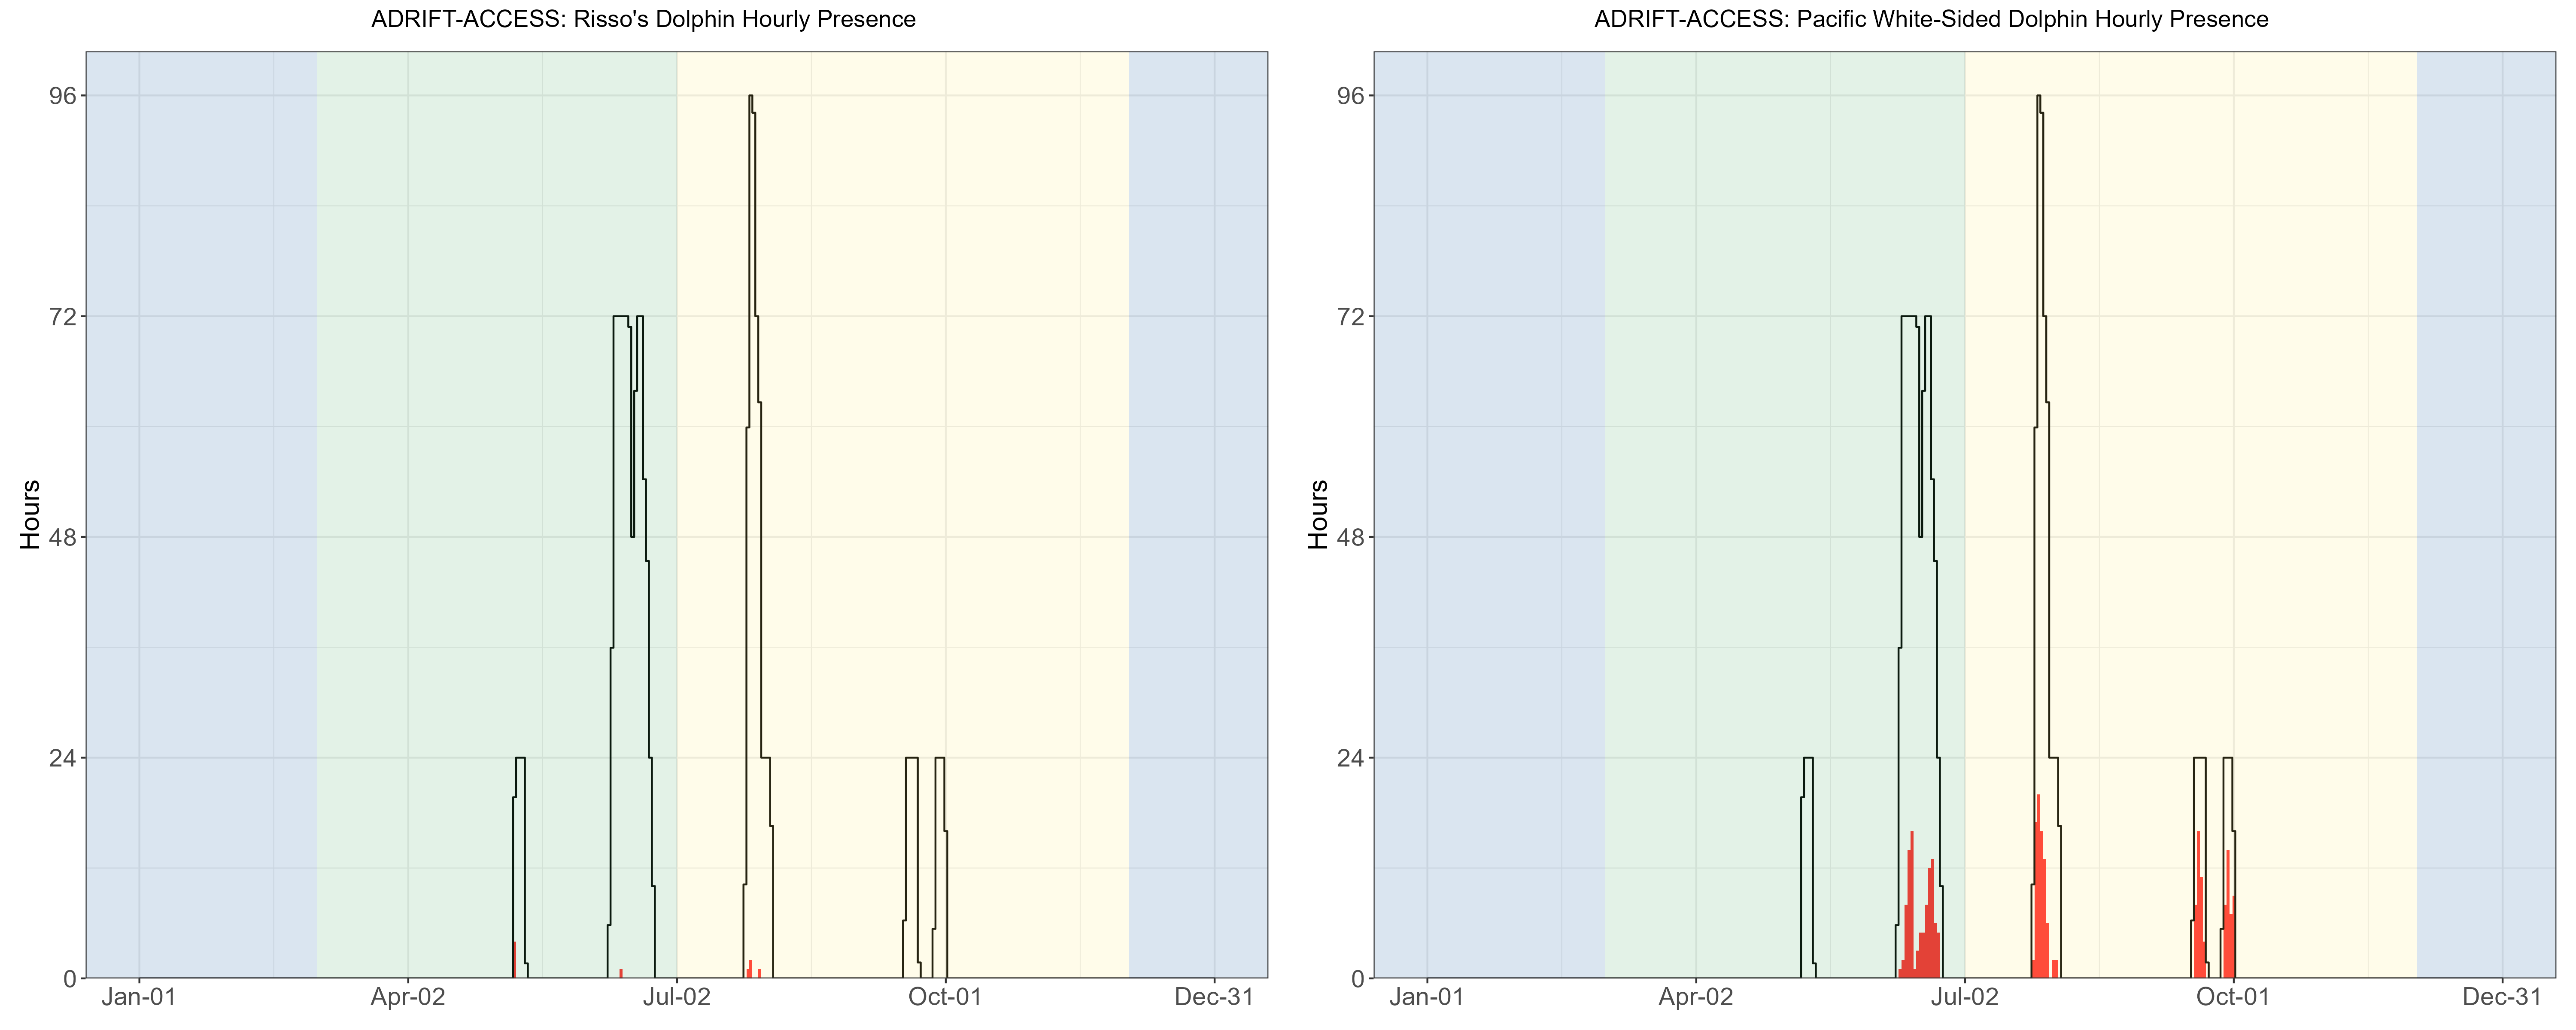
Risso’s and Pacific white-sided dolphins were detected on most/all ACCESS deployments, and there were most likely other species that were detected but that we could not classify to species. The California Current has a high diversity of dolphin species, and species classification is difficult. Currently, there is insufficient validated data for drifting recorders to test the efficacy of existing classifiers on these data, or to develop a drifting-recorder specific classifier. Adrift data are publicly available for future analysis, should improved acoustic classification methods become available.
Narrow Band High Frequency Species (Kogia spp., porpoise)
Calls associated with NBHF species (porpoise and Kogia spp.) were detected in all drifts except the earliest of the upwelling surveys (June, Figure 4) and the hourly probability of detection was higher for the post-upwelling season than for the upwelling season (Table 4).
| Upwelling | Post-Upwelling | Winter | |
|---|---|---|---|
| San Francisco | 0.05 (960) | 0.27 (688) | – |
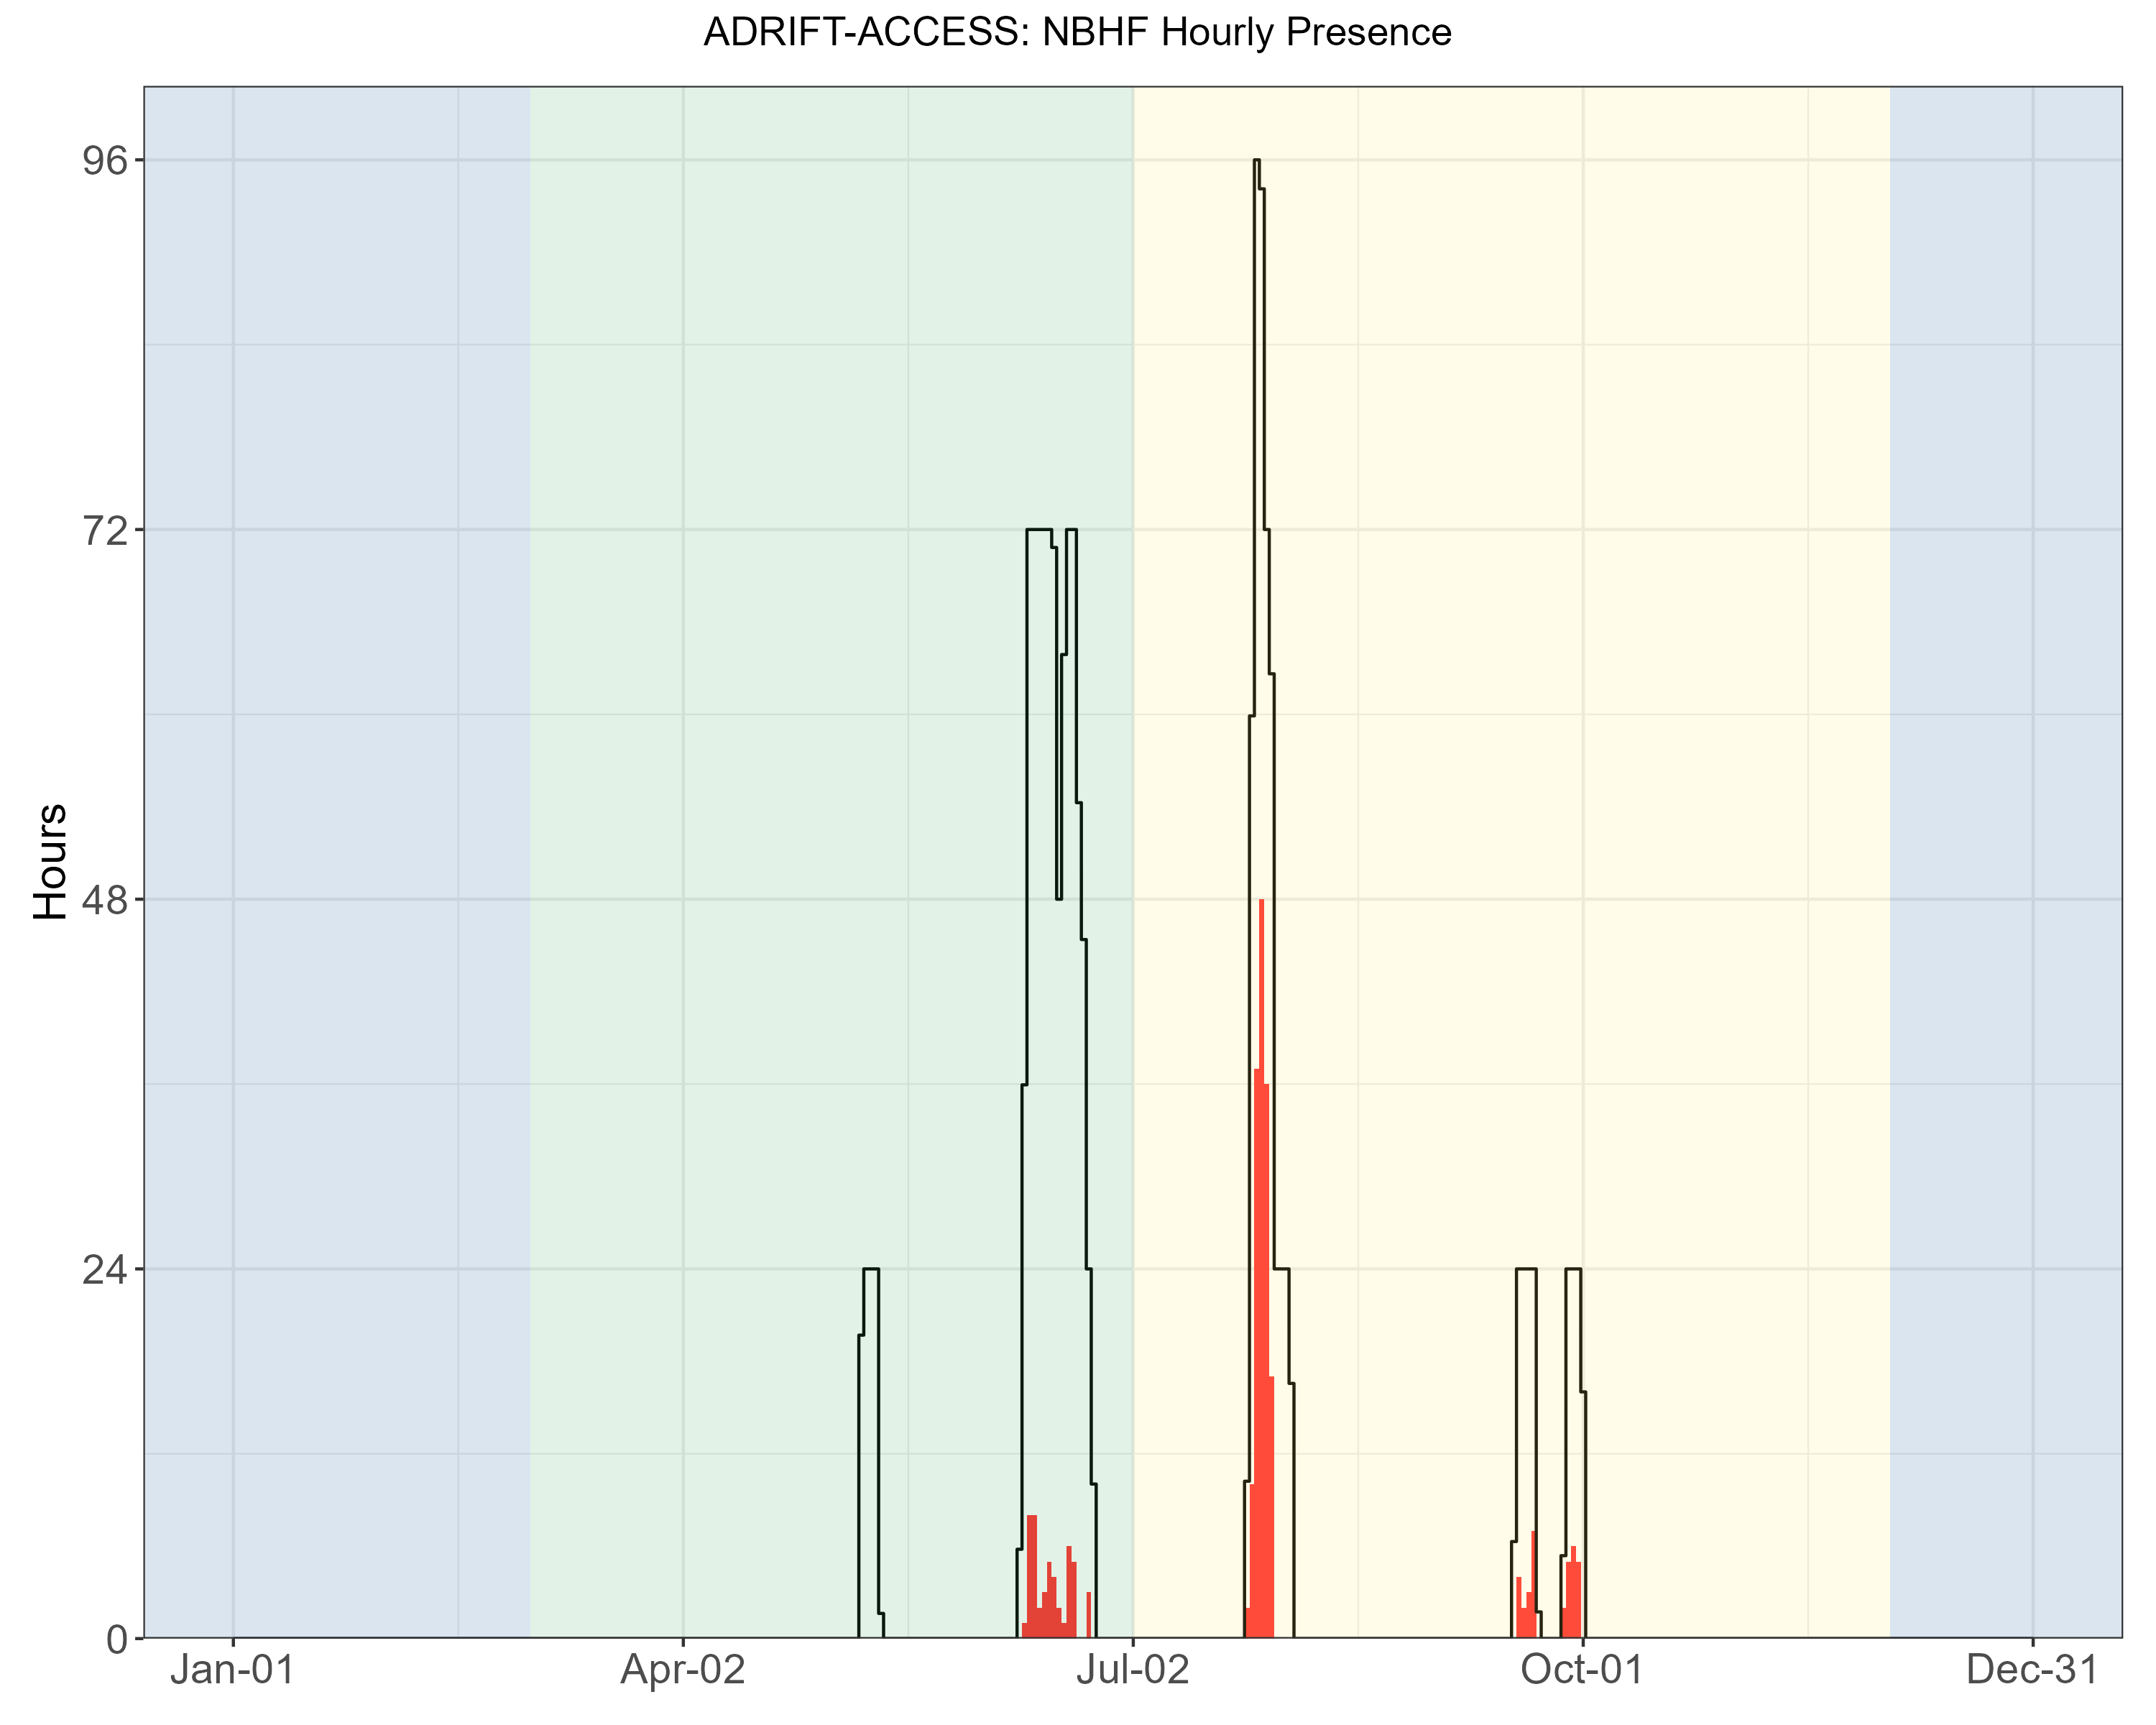
The California Current is home to 4 different species that produce NBHF echolocation clicks: harbor porpoise, Dall’s porpoise, pygmy sperm whales, and dwarf sperm whales. Despite the similarities in their echolocation clicks, these species inhabit different habitats and have different behaviors and life histories. Harbor porpoise inhabit the nearshore waters north of Point Conception, and are very sensitive to noise and other anthropogenic impacts. Dall’s porpoise are fast moving and are often found in mixed species aggregations with dolphins. Both the pygmy and dwarf sperm whales are cryptic deep diving species. Lumping these very different species into one ‘acoustic’ group is problematic, and acoustic classification to species (or at least genus) is needed.
Preliminary efforts at developing a genus-level species classifier for NBHF species in the California Current have shown positive results, and future research will further develop this classifier (see online summary: NBHF Classification). These classifiers will be further developed in 2025 and we hope to re-examine the Adrift-ACCESS NBHF species to refine the species identity in these data.
Blue Whales
Blue whales were detected in all deployments except the initial upwelling deployment Figure 5, with most detections during the post-upwelling season (Table 5).
| Upwelling | Post-Upwelling | Winter | |
|---|---|---|---|
| A Calls | 0.00 (960) | 0.31 (688) | – |
| B Calls | 0.02 (960) | 0.50 (688) | – |
| D Calls | 0.03 (960) | 0.06 (688) | – |
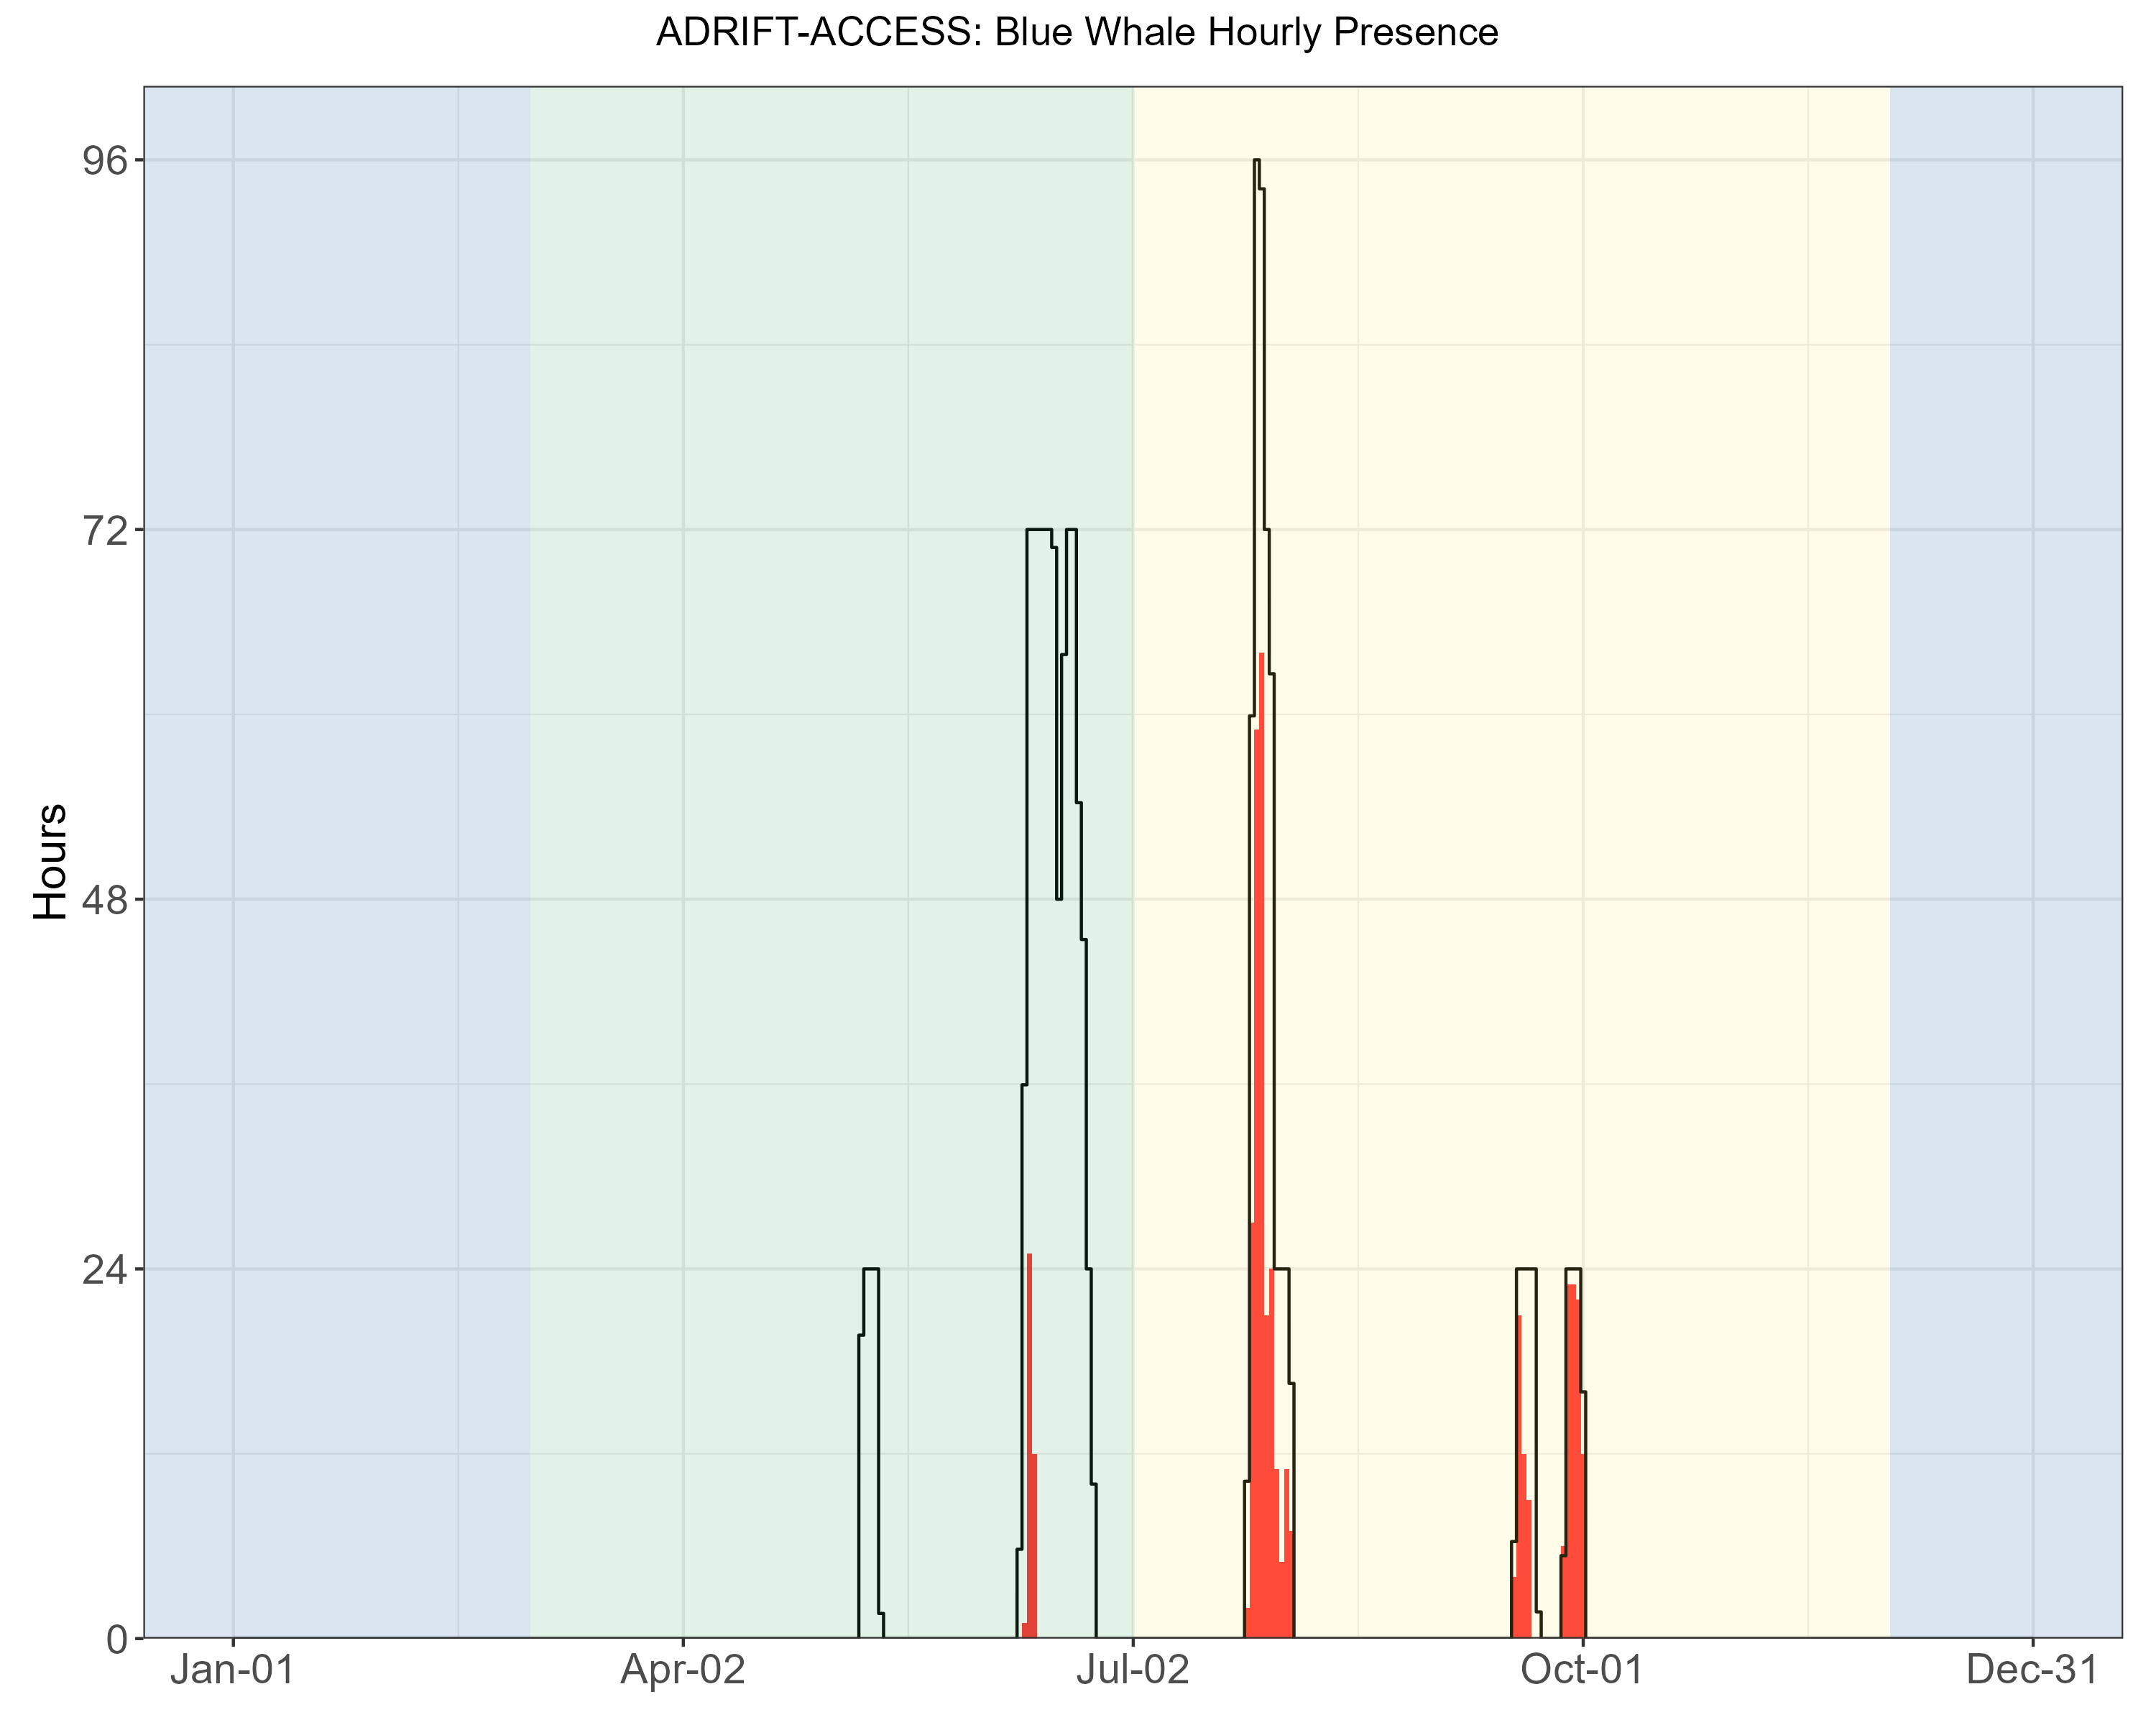
Detection of blue whale calls were primarily A and B calls associated with song, with few detections of D calls during the summer months Figure 6. Blue whale ‘song’ consists of both A and B calls, which can occur individually or in A-B pairs. Detection of both A and B calls were higher during the post-upwelling seasons in all areas (Table 5). There were only a few blue whale B calls detected during the upwelling season off San Francisco. The probability of detecting blue whale B calls was consistently higher than A calls, which reflects research showing that blue whale B calls can be detected at greater ranges than blue whale A calls (McDonald et al. 2001). Blue whale B calls can be readily classified by an experienced analyst when the SNR (signal to noise ratio) is low.
Blue whale D calls have been associated with feeding behavior (Oleson, Wiggins, and Hildebrand 2007), and detection of D calls were primarily during the summer (late upwelling/early post-upwelling, Figure 6). The probability of detecting D calls was much lower than detecting A and/or B calls, and low SNR D calls are more readily confused with low frequency downsweep calls produced by other species, reducing the overall effective detection range for these calls.
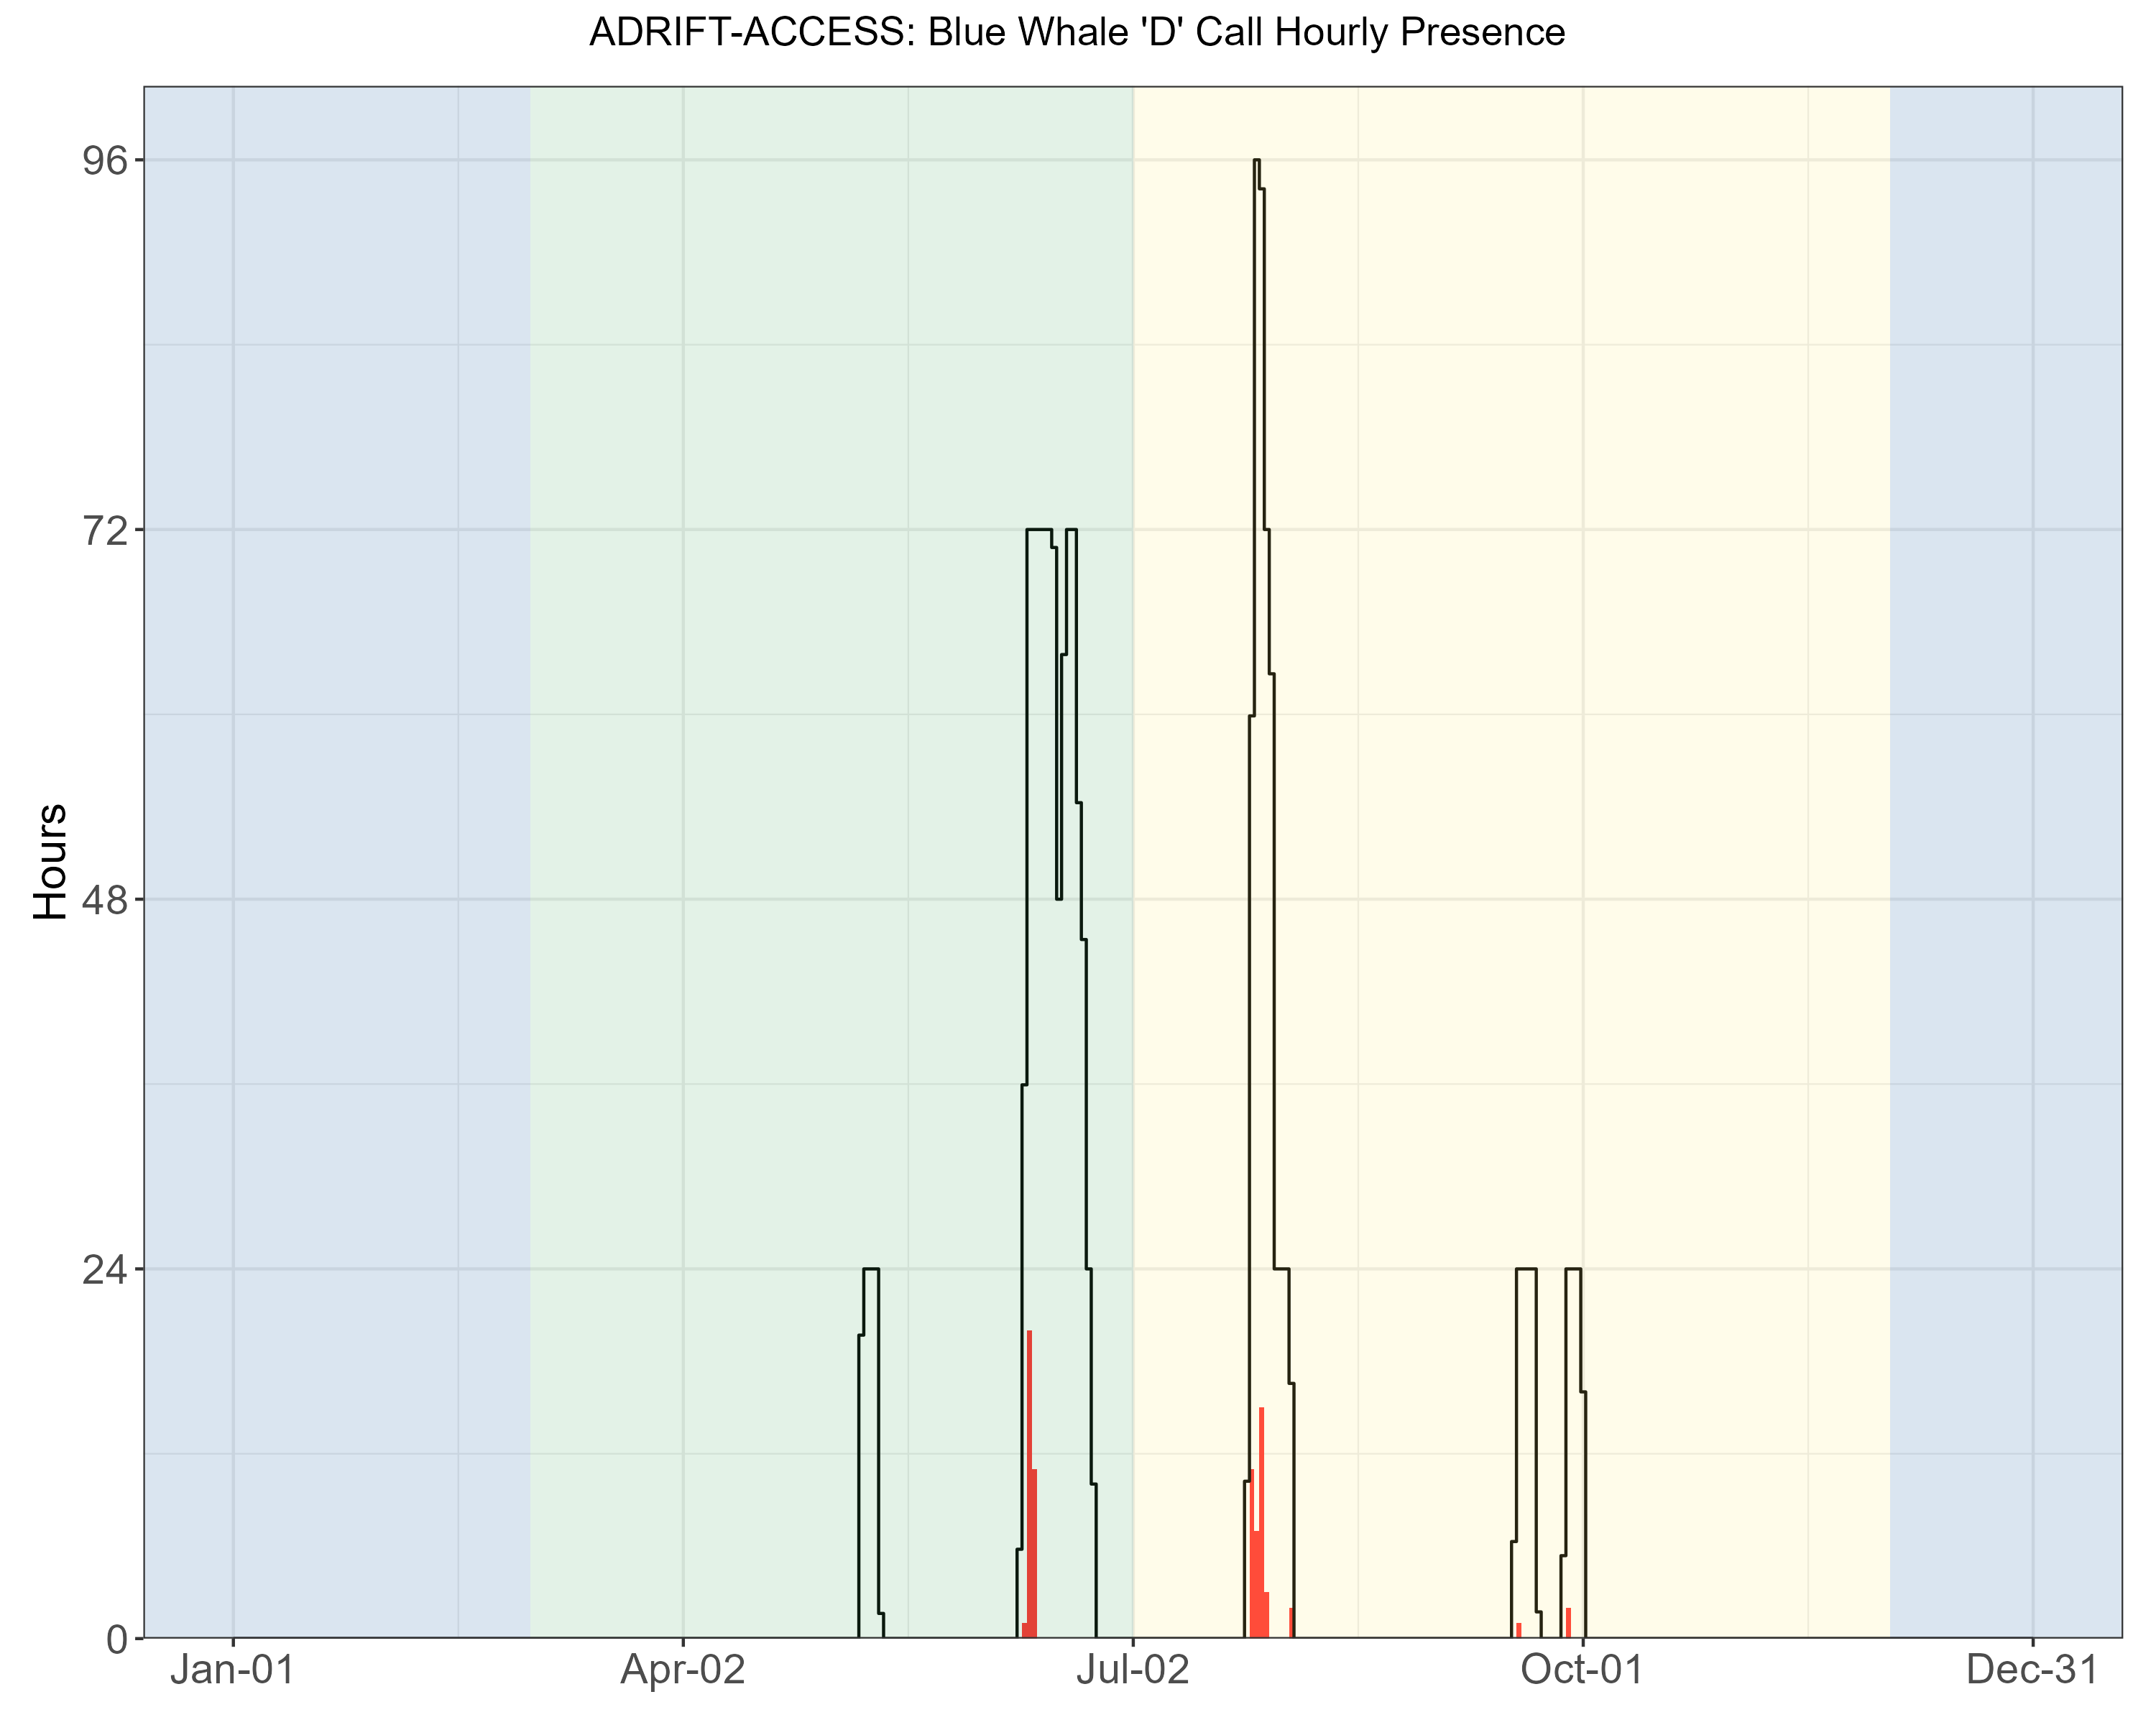
Detection of blue whales was higher during the post-upwelling season, and detections were dominated by the A/B song call types produced by males. Foraging associated ‘D’ calls were primarily detected during the post-upwelling season, and at much lower detection probabilities than A/B call types. Blue whale calls, especially the ‘B’ call type, can be detected at great ranges and the range of potential sound source locations can be large. Preliminary methods to localize low frequency sounds on clustered drifting recorders shows promise (see online summary: Modeling Habitat Use), and adoption of these methods may improve our understanding of the habitat use of these species in the greater area.
Fin Whales
Fin whales 20 Hz calls were detected during both the upwelling and post-upwelling seasons, with greater hourly detection during the post-upwelling deployments (Table 6, Figure 7). There were no detection of fin whale 40 Hz calls during the Adrift-ACCESS deployments (Table 6).
| Upwelling | Post-Upwelling | Winter | |
|---|---|---|---|
| 20 Hz | 0.04 (960) | 0.12 (688) | – |
| 40 Hz | 0.00 (960) | 0.00 (688) | – |
Fin whale 20 Hz detections were lower off San Francisco than other areas (see online Adrift results), though detection of low frequency fin whale calls in this area may be compromised by low frequency noise associated with high levels of low frequency noise associated with large shipping traffic (container ships). The fin whale 20 Hz call is the most commonly reported and is thought to be used as a social call to establish and maintain contact when produced in irregular sequences (Edds-Walton 1997) and it may serve a reproductive function when produced by males in a regular sequence forming song (Croll et al. 2002). Here we did not differentiate between irregular and regular sequencing.
The 40 Hz call has a more irregular pattern and has been positively associated with prey biomass, providing evidence that it is associated with a foraging function (Romagosa et al. 2021). There were no detections of fin whale 40 Hz calls in this region (Table 6).
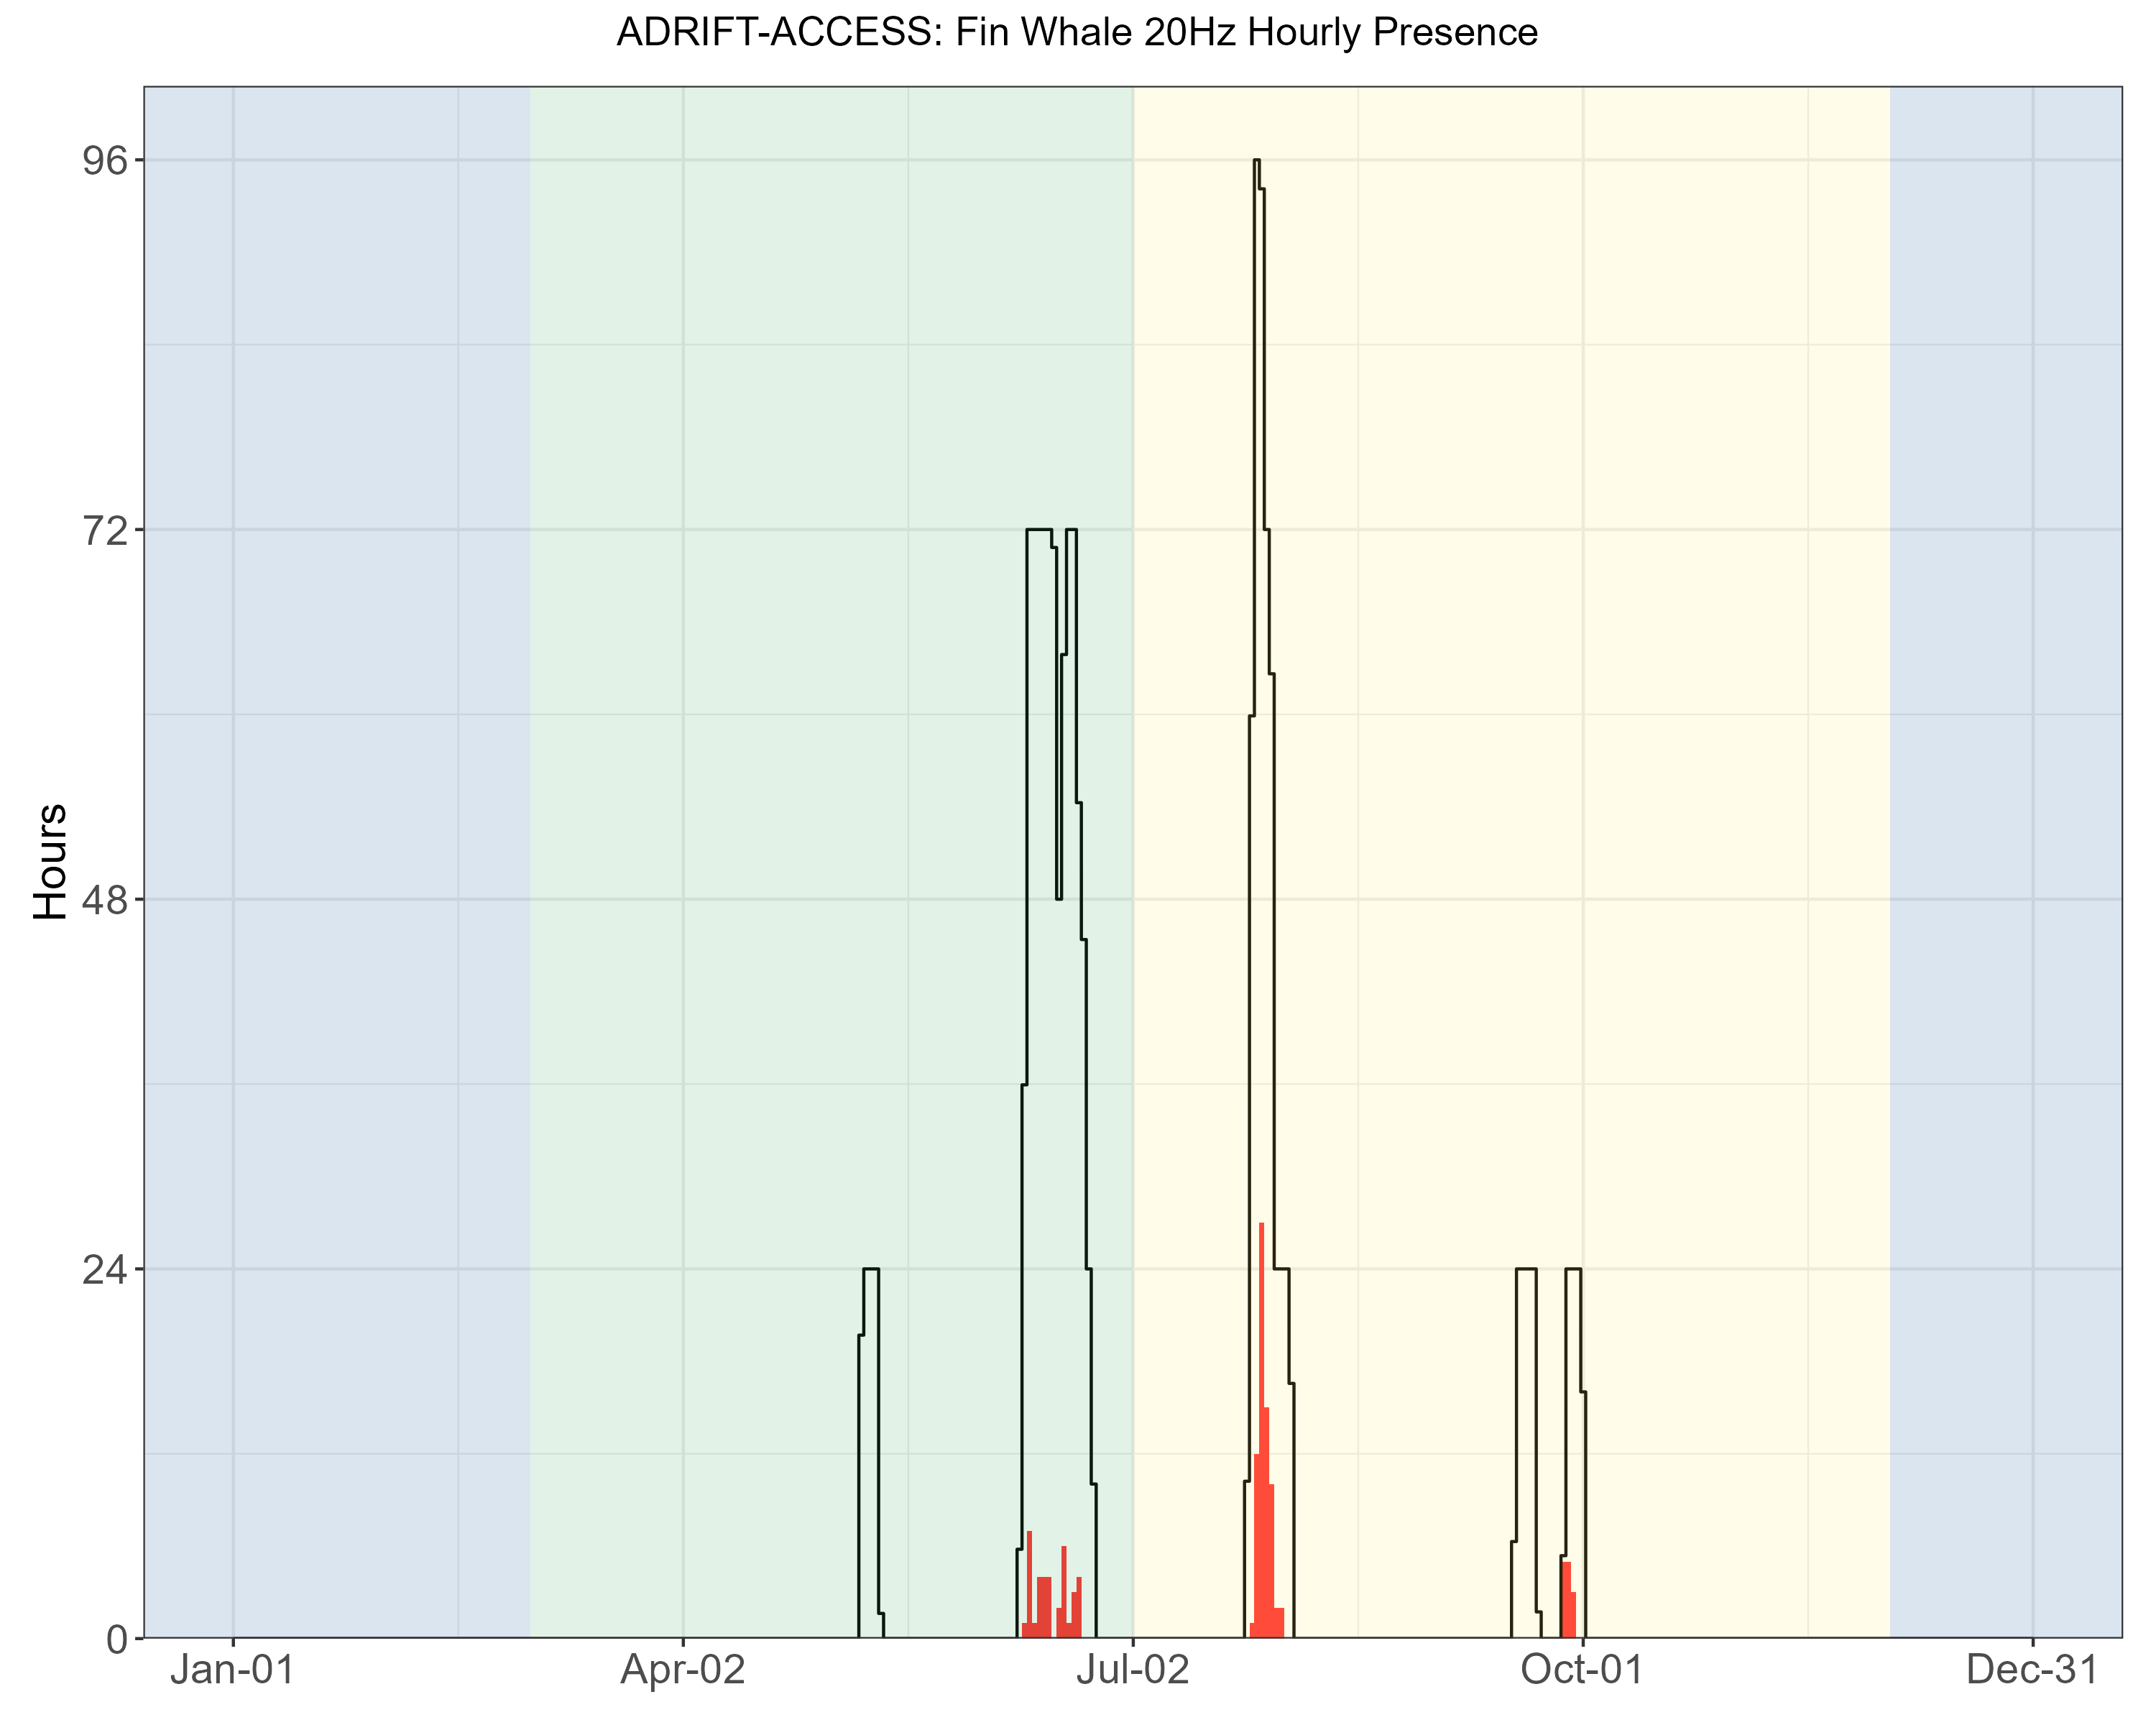
These data were used to improve and test a fin whale classifier with excellent results (see online summary: Fin Whale AI), and future adoption of these methods may allow for an improved approach of classifying variability in fin whale call patterns.
Humpback Whales
Humpback whales were detected during most deployments (Figure 8), with higher probability of detection in the post-upwelling season off San Francisco (Table 7). Hourly probability of detecting song was higher in the post-upwelling than the upwelling season (Table 7).
| Upwelling | Post-Upwelling | Winter | |
|---|---|---|---|
| Song | 0.03 (960) | 0.36 (688) | – |
| Social Calls | 0.01 (960) | 0.24 (688) | – |
| Undetermined | 0.06 (960) | 0.28 (688) | – |
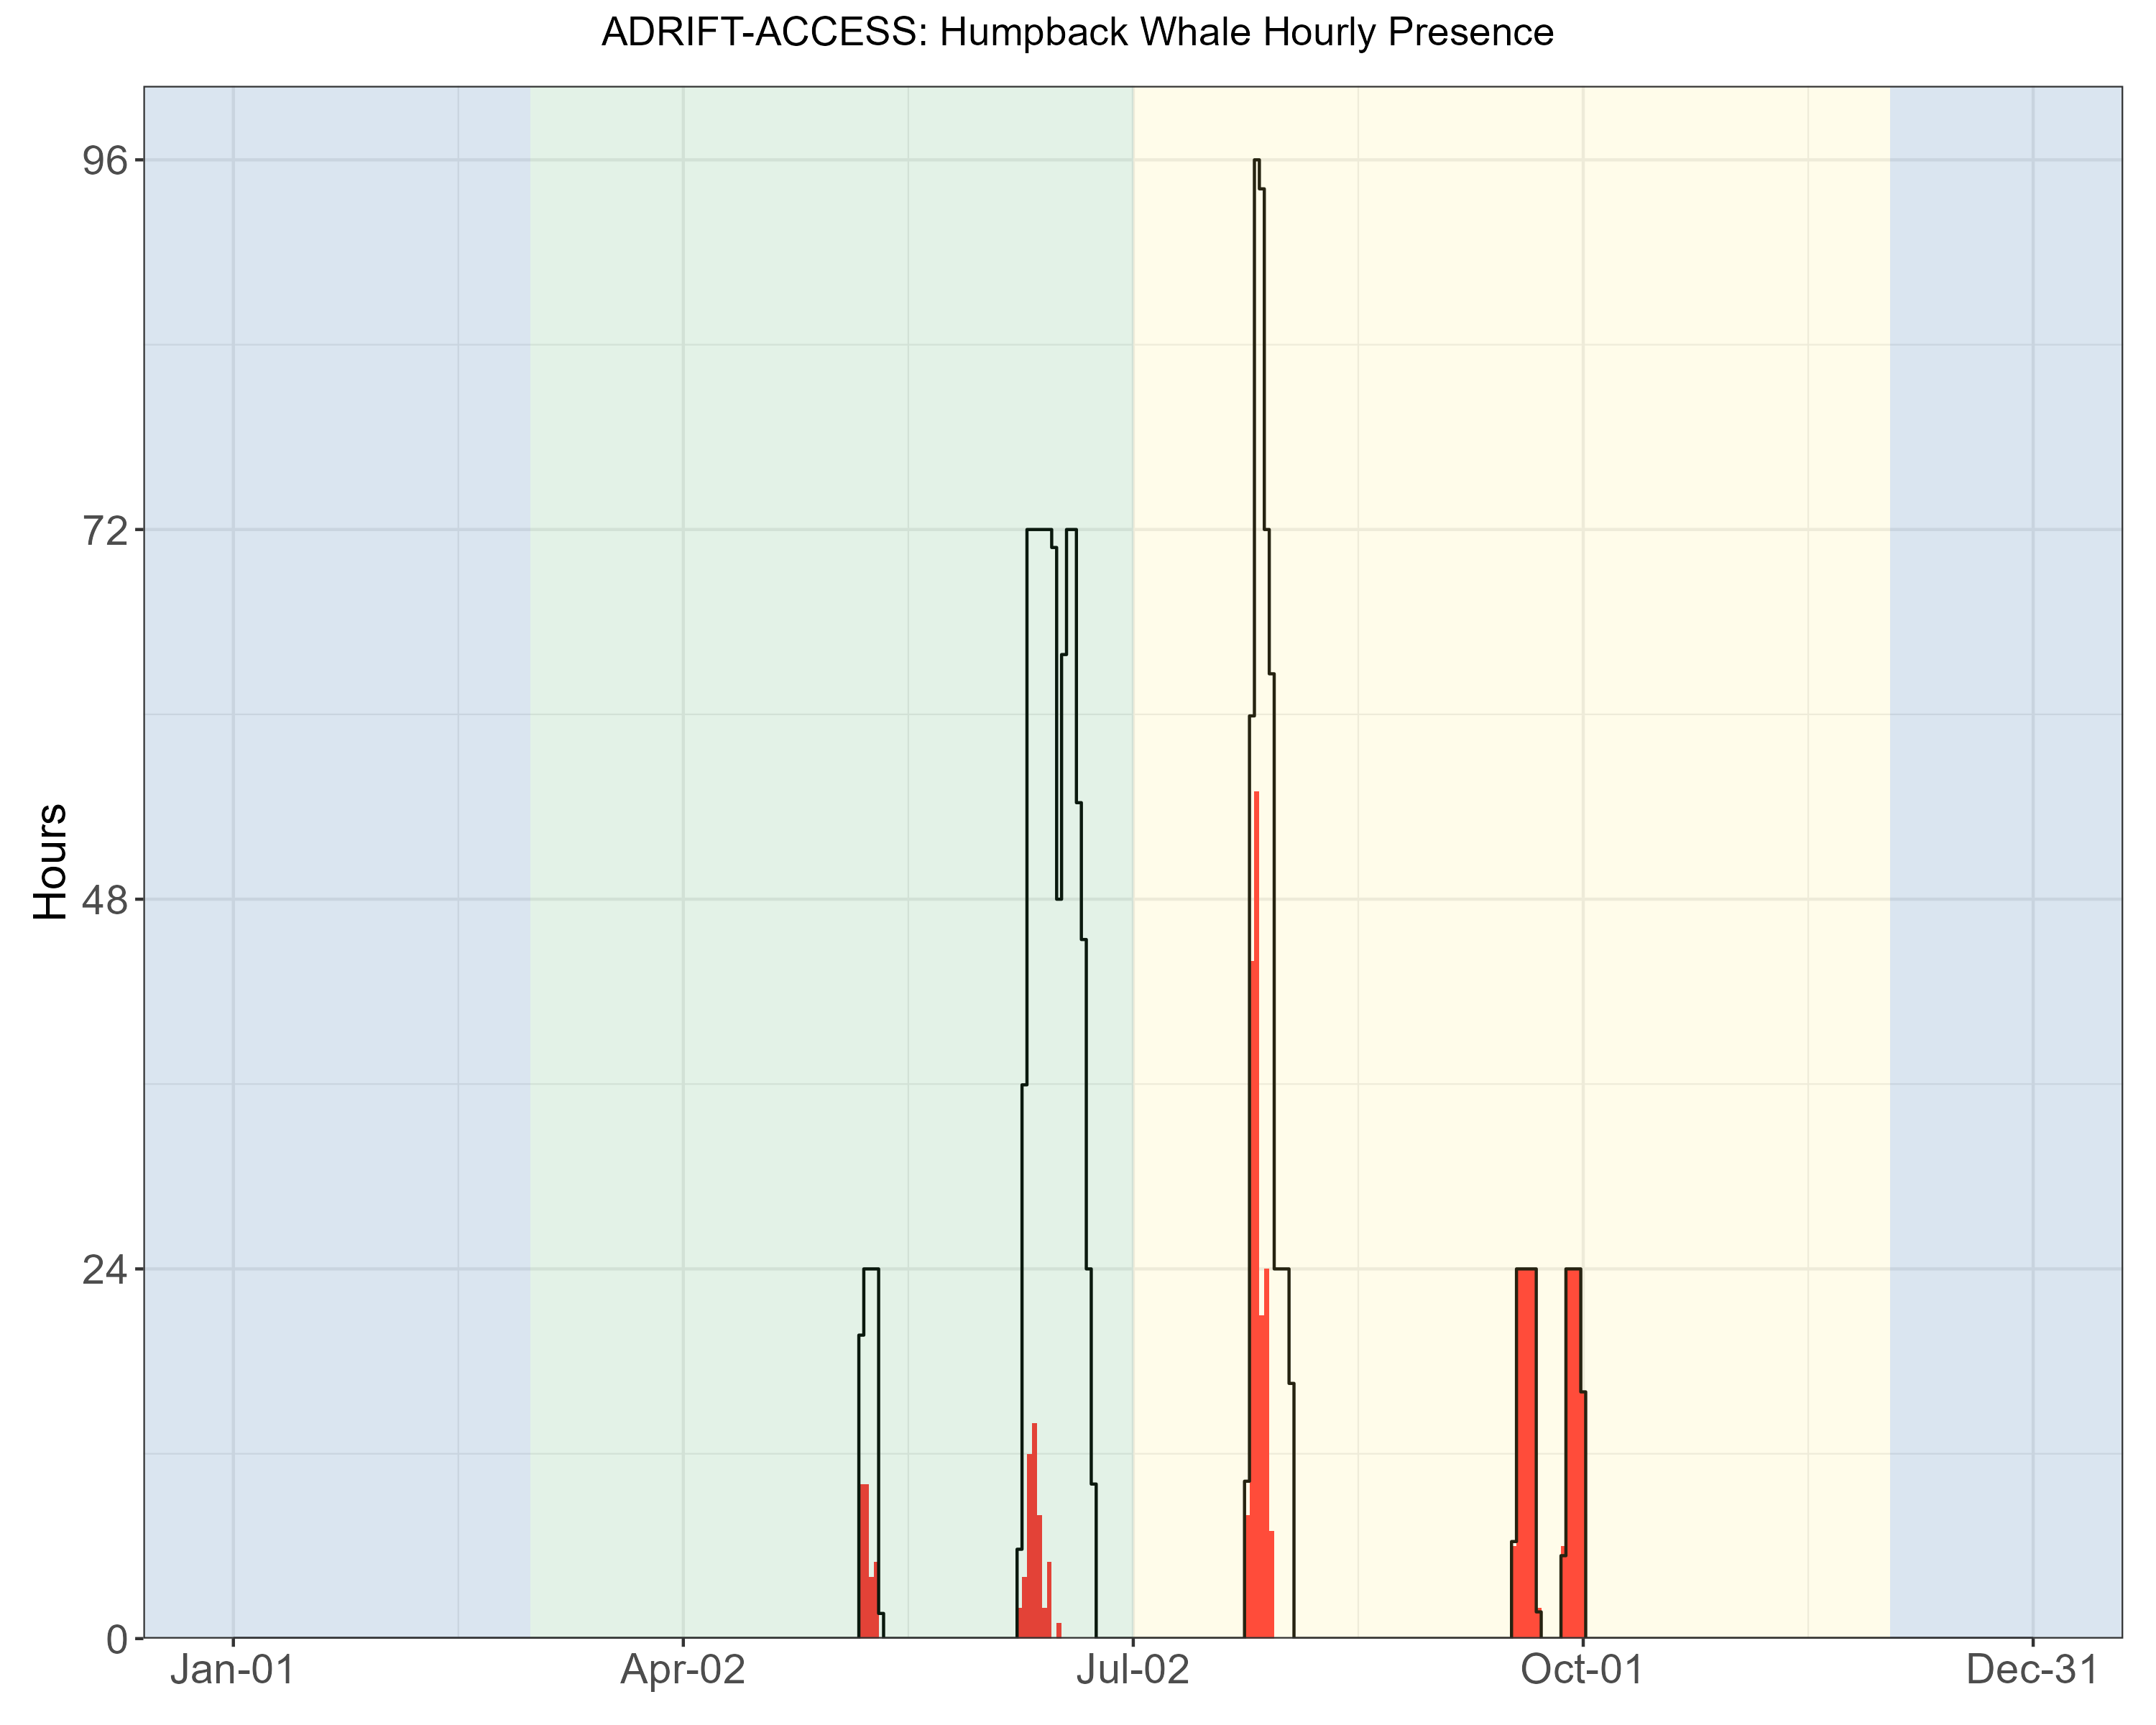
There were no deployments during the winter oceanographic season, but high probability of detecting humpback song during the late fall aligns with the production of song during the southern winter migration (Clapham and Mattila 1990). There were several drifts in which humpback song dominated the recordings (Figure 9). The acoustic features of humpback whale song, including high source level and series of calls produced over long time spans, naturally lead to high detection rates (Au et al. 2006). While recordings dominated by song may be attributed to one or a few animals, social sounds may be attributed to larger numbers of animals (Ryan et al. 2019).
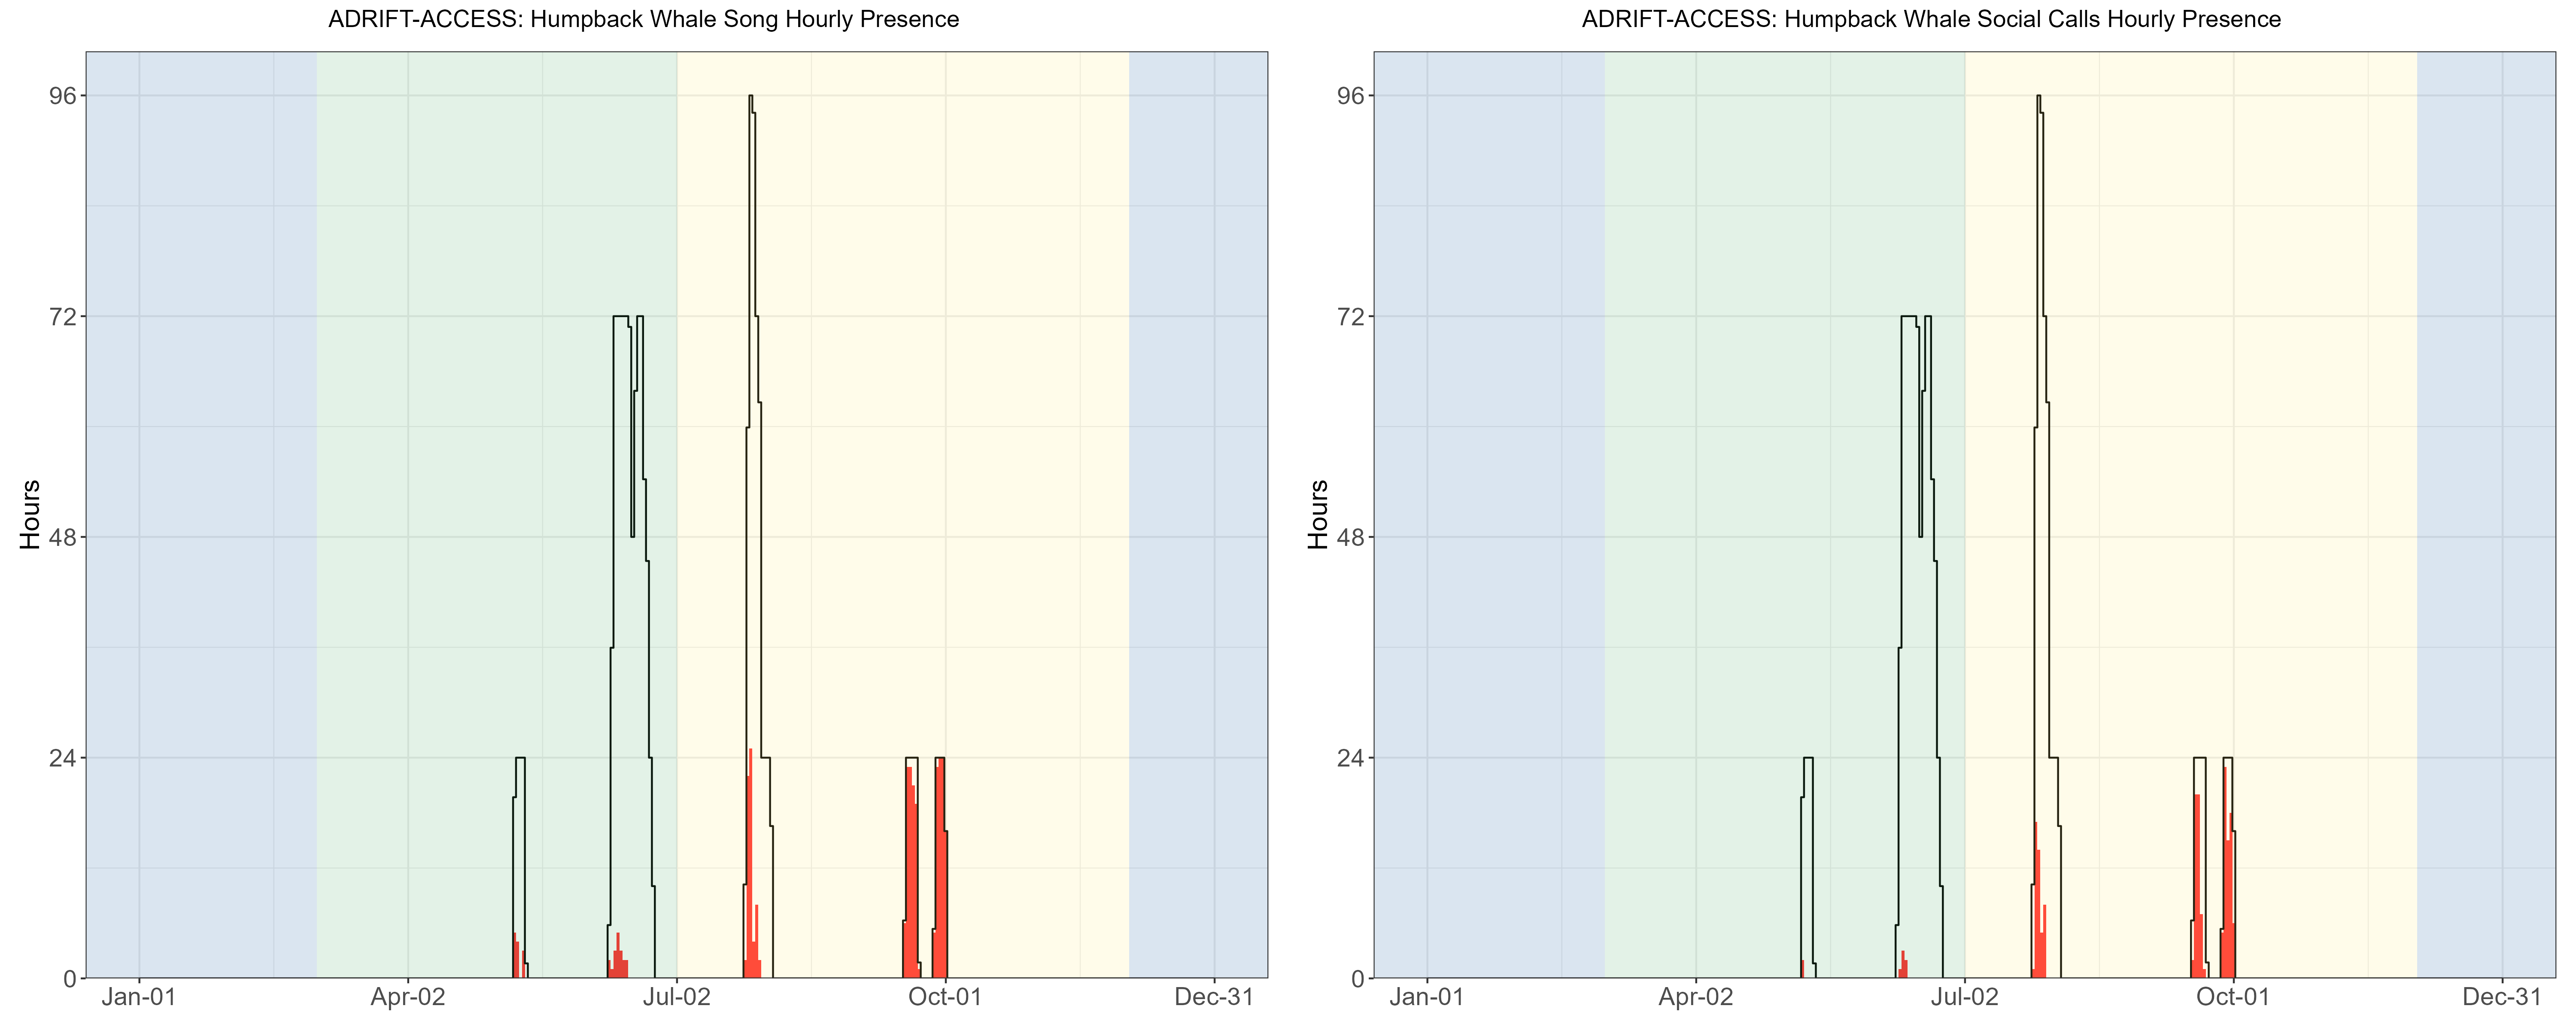
Humpback whales are notoriously difficult PAM subjects due to their very active vocal behavior (in quantity and variability). Many recordings can be dominated by humpback song, and this song may be the result of a single individual. There is significant research on many of the non-song vocalizations, but detection and classification of these sounds require expertise and manual classification. There are significant numbers of annotated datasets, and development of a machine learning method to detect and classify these sounds would allow researchers to better understand how the detection of humpback sounds can inform the demographic composition and habitat use of these species throughout the California Current.
Bryde’s and Sei Whales
There were no confirmed detections of calls associated with Bryde’s or sei whales during Adrift-ACCESS. Bryde’s whale distribution is in the tropical and subtropical waters, with occasional northward incursion into the Southern California Bight (Kerosky et al. 2012). The Adrift-ACCESS deployments were north of their expected range; however, warming oceans associated with climate change may lead to an increase in detections in northern latitudes over time.
There were no known acoustic detections of sei whales during the Adrift-ACCESS deployments. Little is known about sei whales in the North Pacific, and to our knowledge there is only one confirmed recording of sei whales in the North Pacific, near Hawaii (Rankin and Barlow 2007).
Gray Whales
Gray Whales Sounds associated with gray whales were only detected on a few recordings during the post-upwelling Adrift-ACCESS deployments (Table 8, Figure 10). There is a significant overlap in spectral content for humpback and gray whale calls and care should be taken when inferring gray whale presence from data with concurrent humpback whale presence.
| Upwelling | Post-Upwelling | Winter | |
|---|---|---|---|
| San Francisco | 0.00 (960) | 0.07 (688) | – |
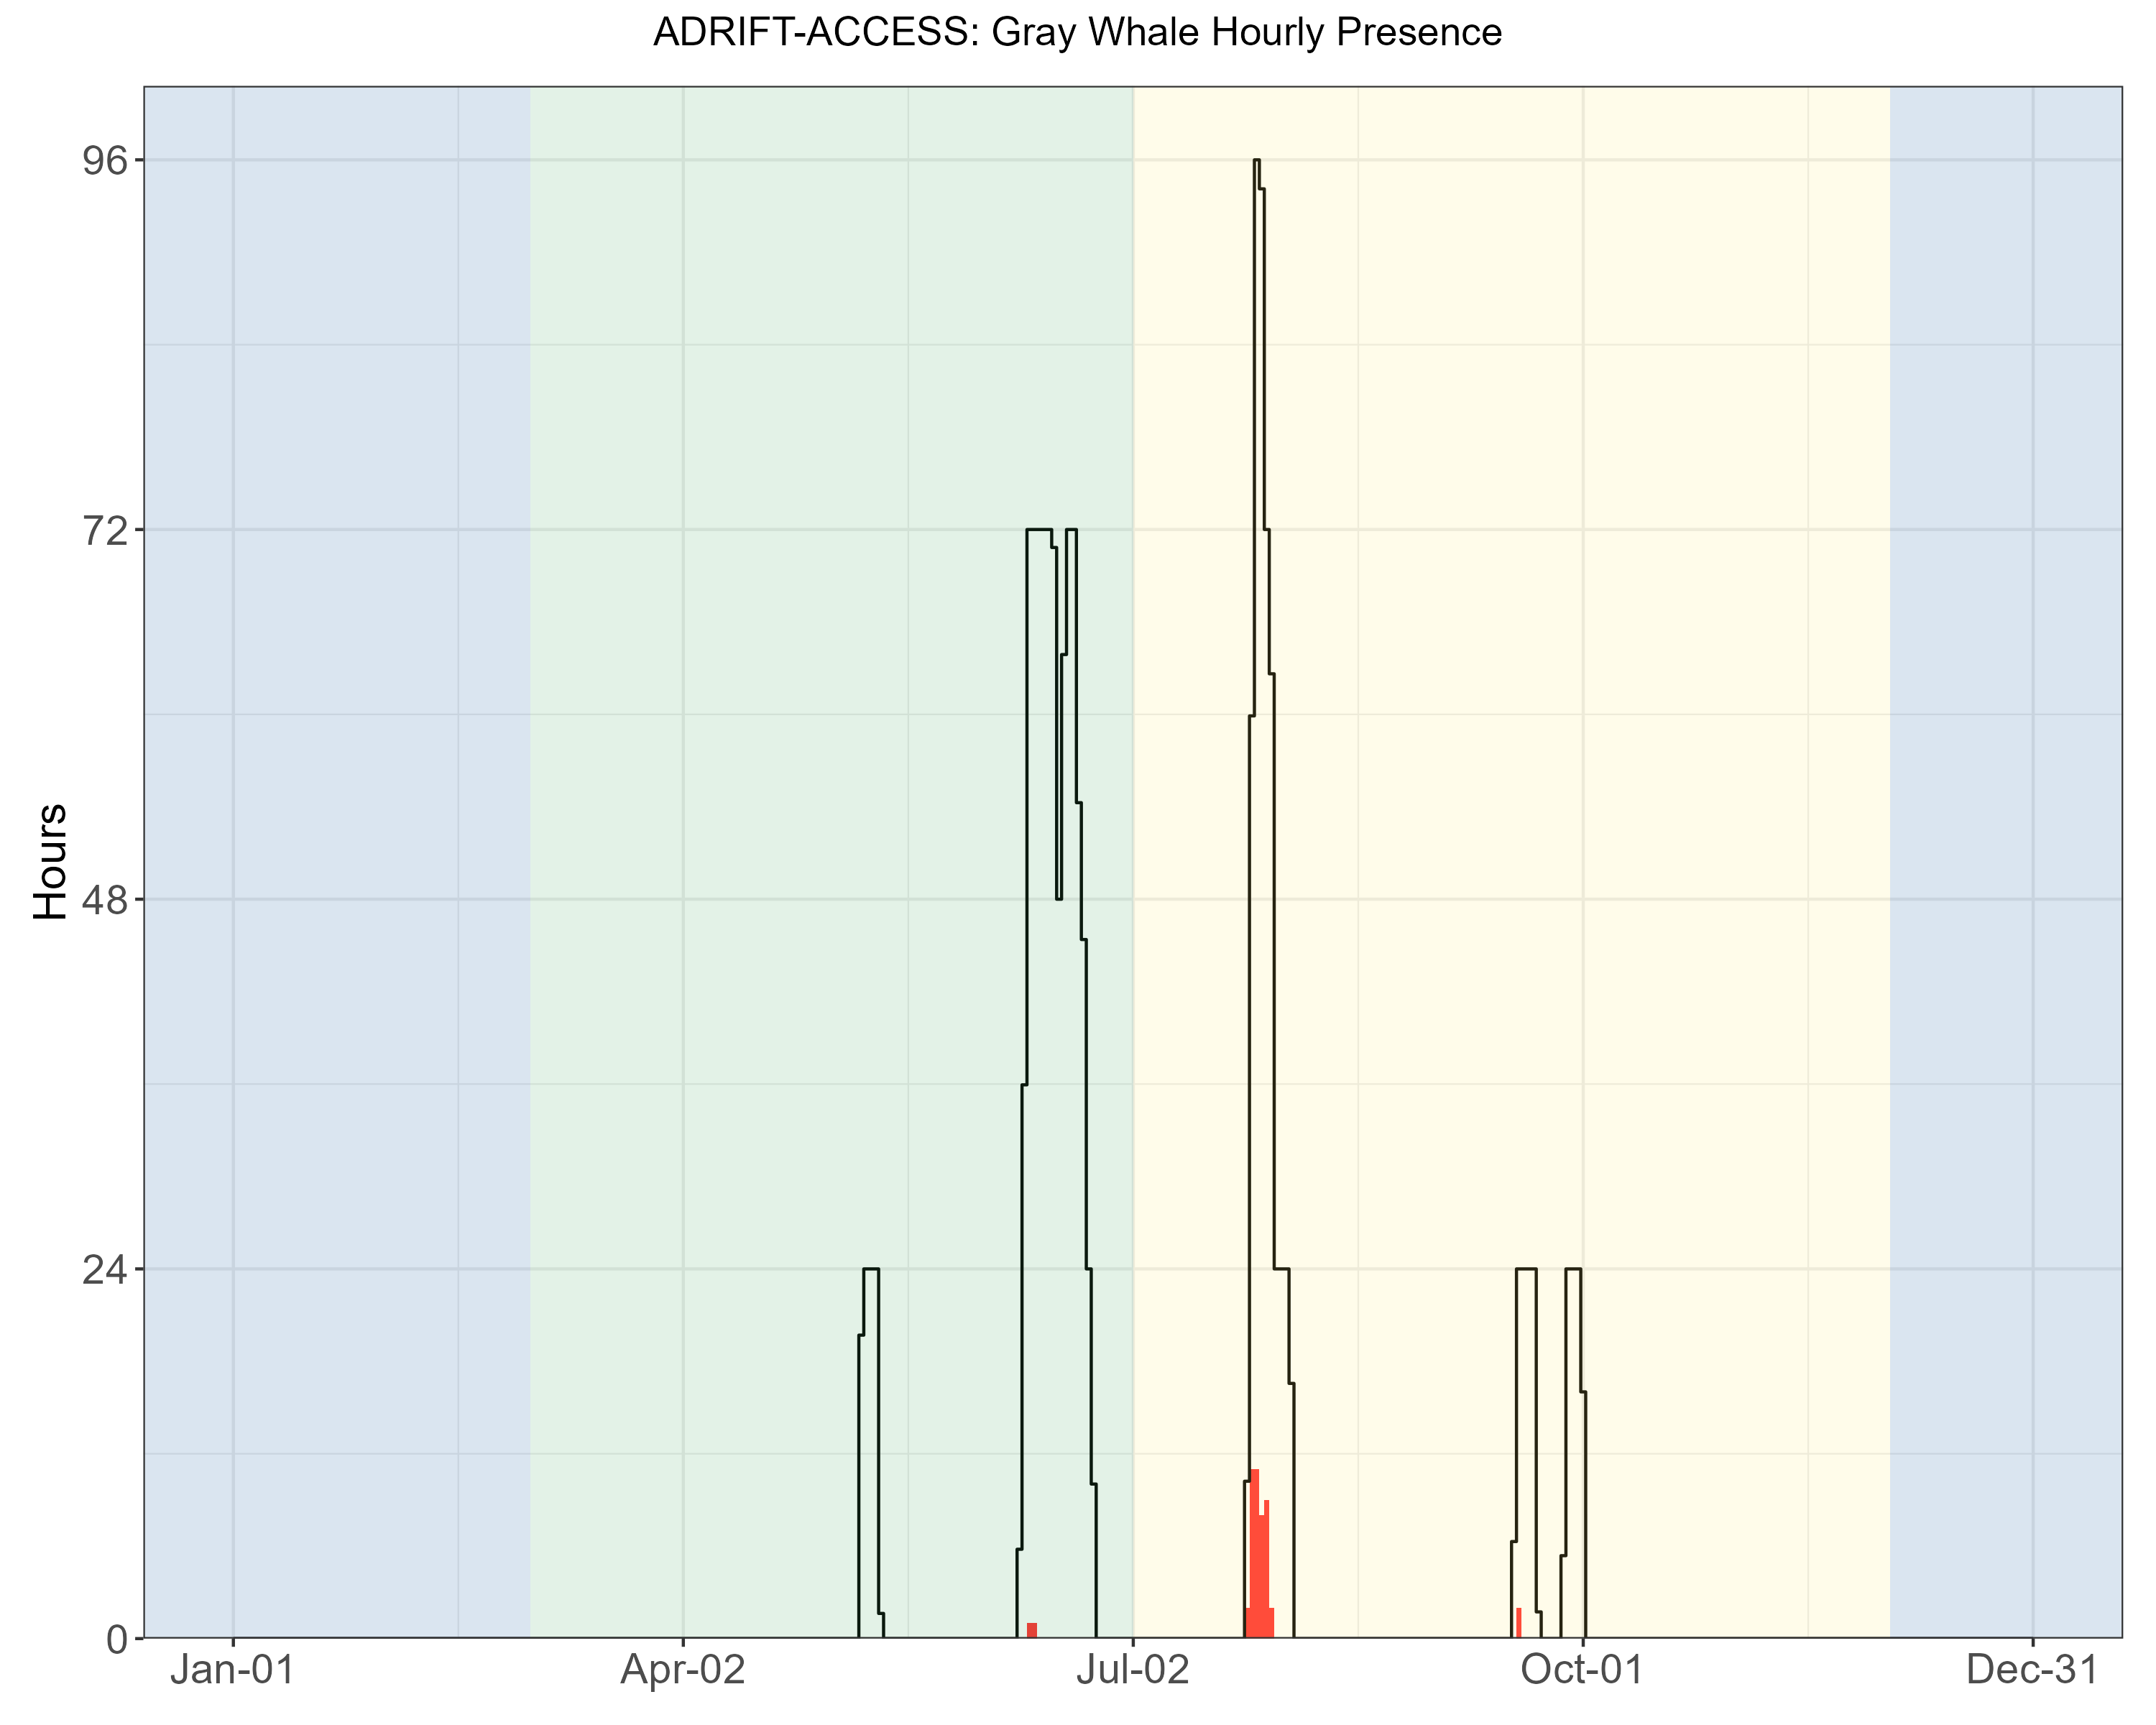
Most Eastern North Pacific gray whales use the California Current to migrate between their feeding grounds in the north and their winter breeding grounds in Baja California. A subpopulation of these whales known as the ‘Pacific Coast Feeding Group’ feed in the California Current off Northern California, Oregon, and Washington during the upwelling and post-upwelling seasons (Barlow, Strong, and Torres 2024). Gray whales are typically found in the nearshore waters, but do occur in offshore waters.
Minke Whales
There were no detections of minke whale boings during the Adrift-ACCESS. Minke whale boing calls are considered ‘song’ and typically detected during the winter and early spring months where our study has limited effort (Rankin and Barlow 2005). The lack of detections could be due to low population densities or that minkes use coastal waters. Research is needed to improve our knowledge of the minke whale vocal repertoire.