Contributors to Soundscape
The marine soundscape includes sounds associated with physical drivers (rain, waves, earthquakes), biological sources (sounds produced by marine mammals, fish, and invertebrates), as well as anthropogenic sounds. In this study we examined sounds attributed to a number of marine mammal species as well as ship noise. Temporal variation (marked in hourly bins) in the contribution of these sounds to the overall soundscape are provided by the acoustic scene.
An acoustic scene provides a visualization of the spectral variation in the contributors to the soundscape, where detection of various species classes is noted by the approximate frequency of their sounds.
For this visualization, we used the following frequency range for these detections:
blue whale (15 - 25 Hz),
fin whale (20 - 50 Hz),
humpback whale (50 - 2,000 Hz),
sei whale (50 - 500 Hz),
gray whale (100 - 2,000 Hz),
minke whale (1,000 -2,000 Hz),
sperm whale (1,000 - 20,000 Hz),
dolphins (1,000 - 25,000 Hz),
beaked whales (25,000 - 60,000 Hz),
NBHF species (80,000 - 120,000 Hz), and
ship noise (100 - 1,000 Hz).
Acoustic Scene summaries are provided below for each region, season, and year. Individual acoustic scenes for each drift are provided in the Expanded Datasets for Adrift, PASCAL, and CCES Surveys.
Oregon
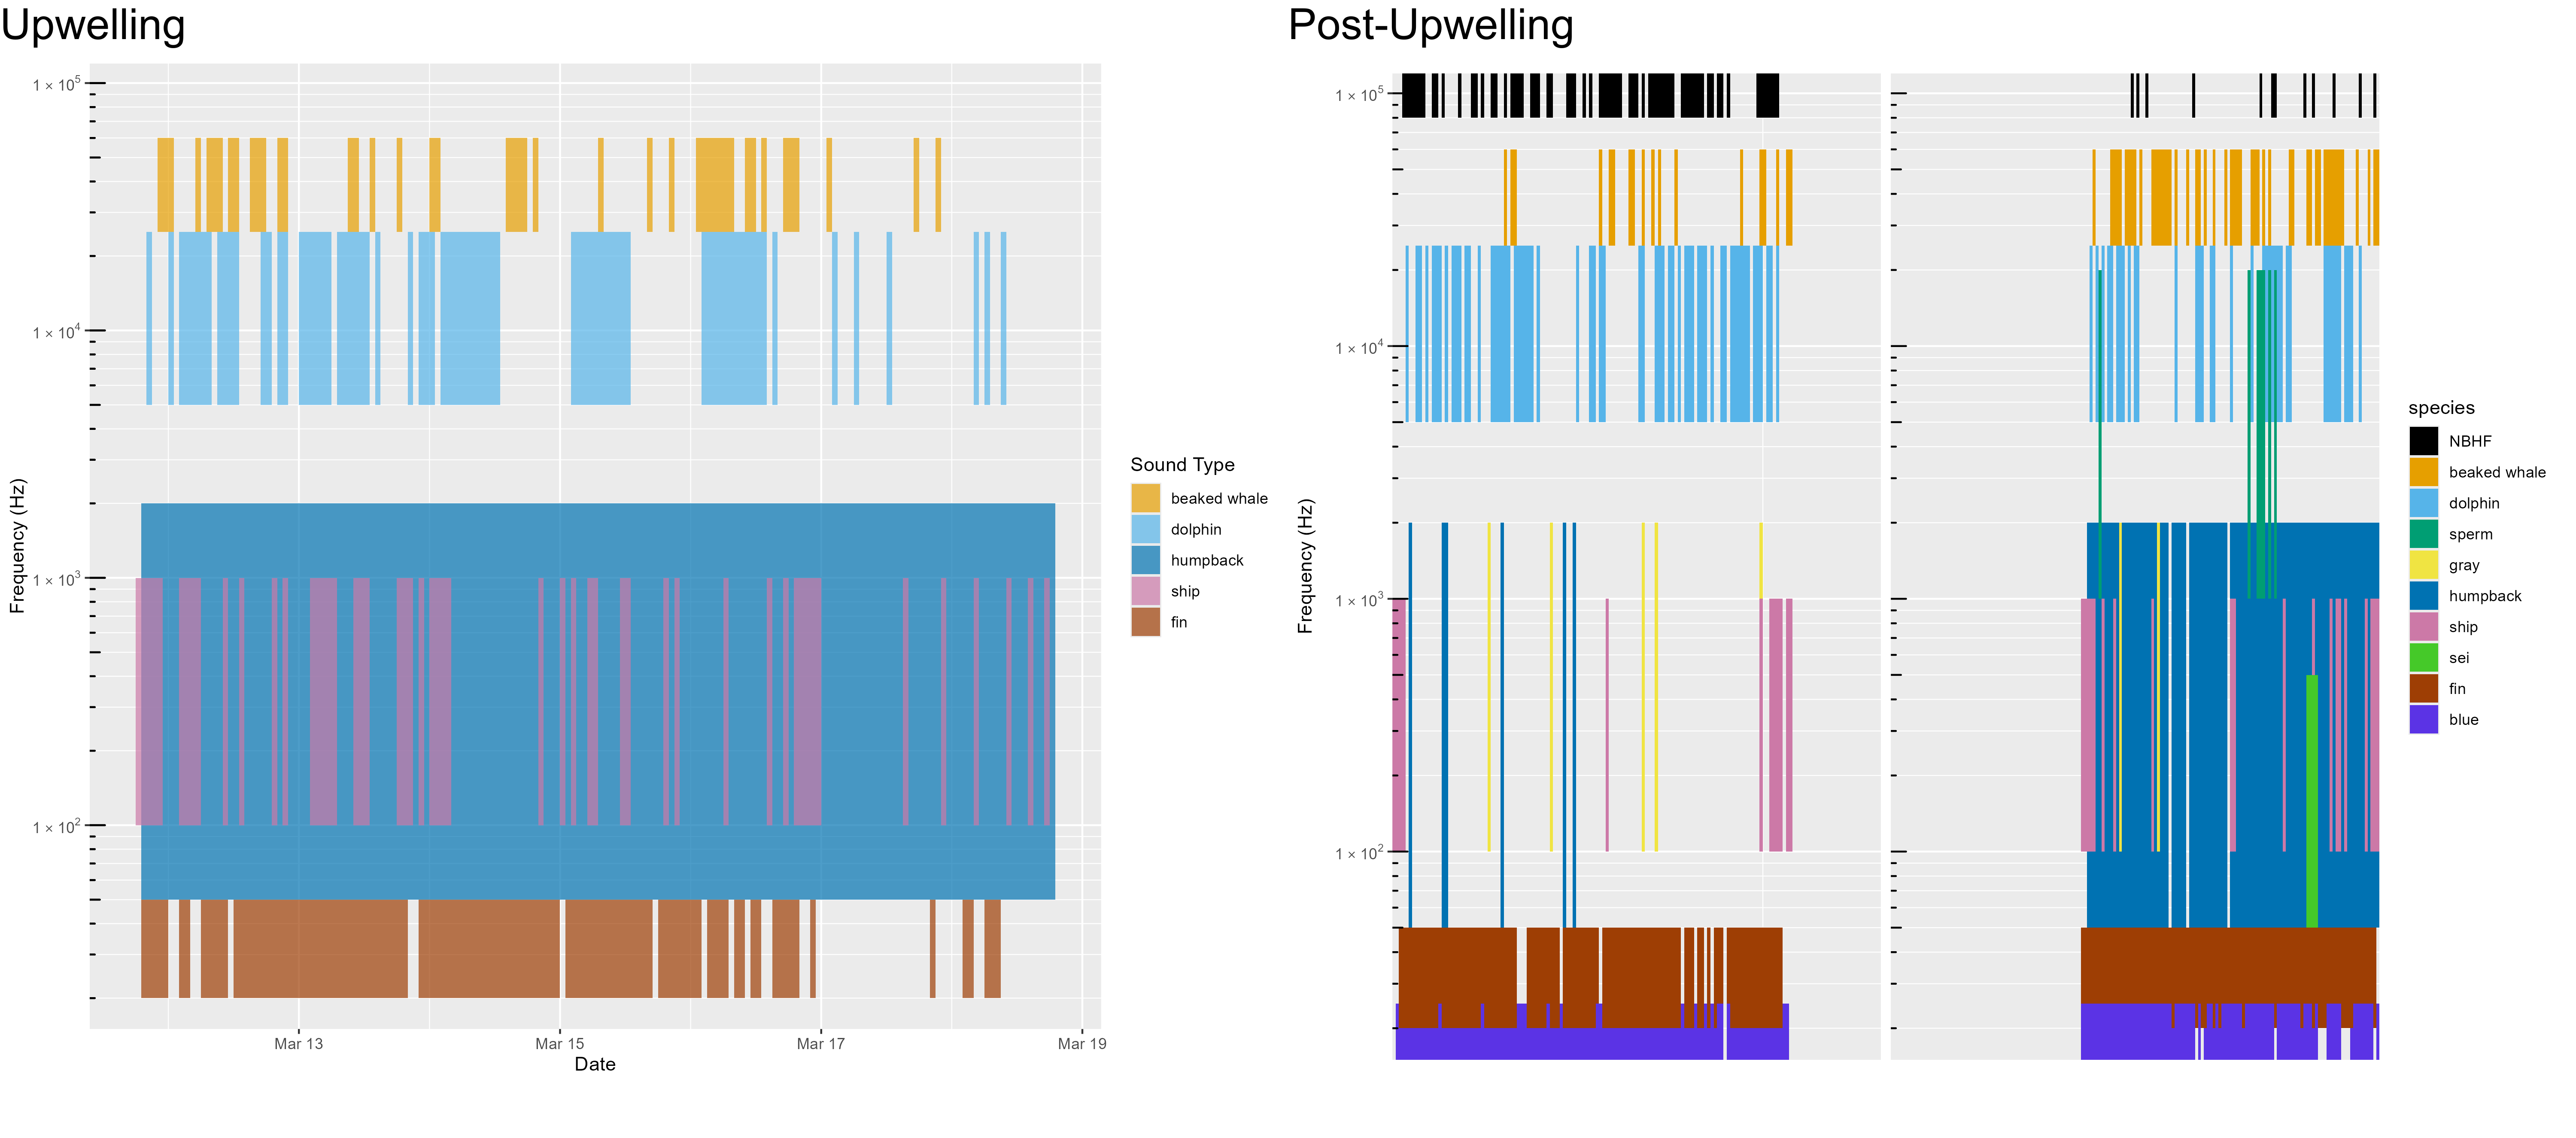
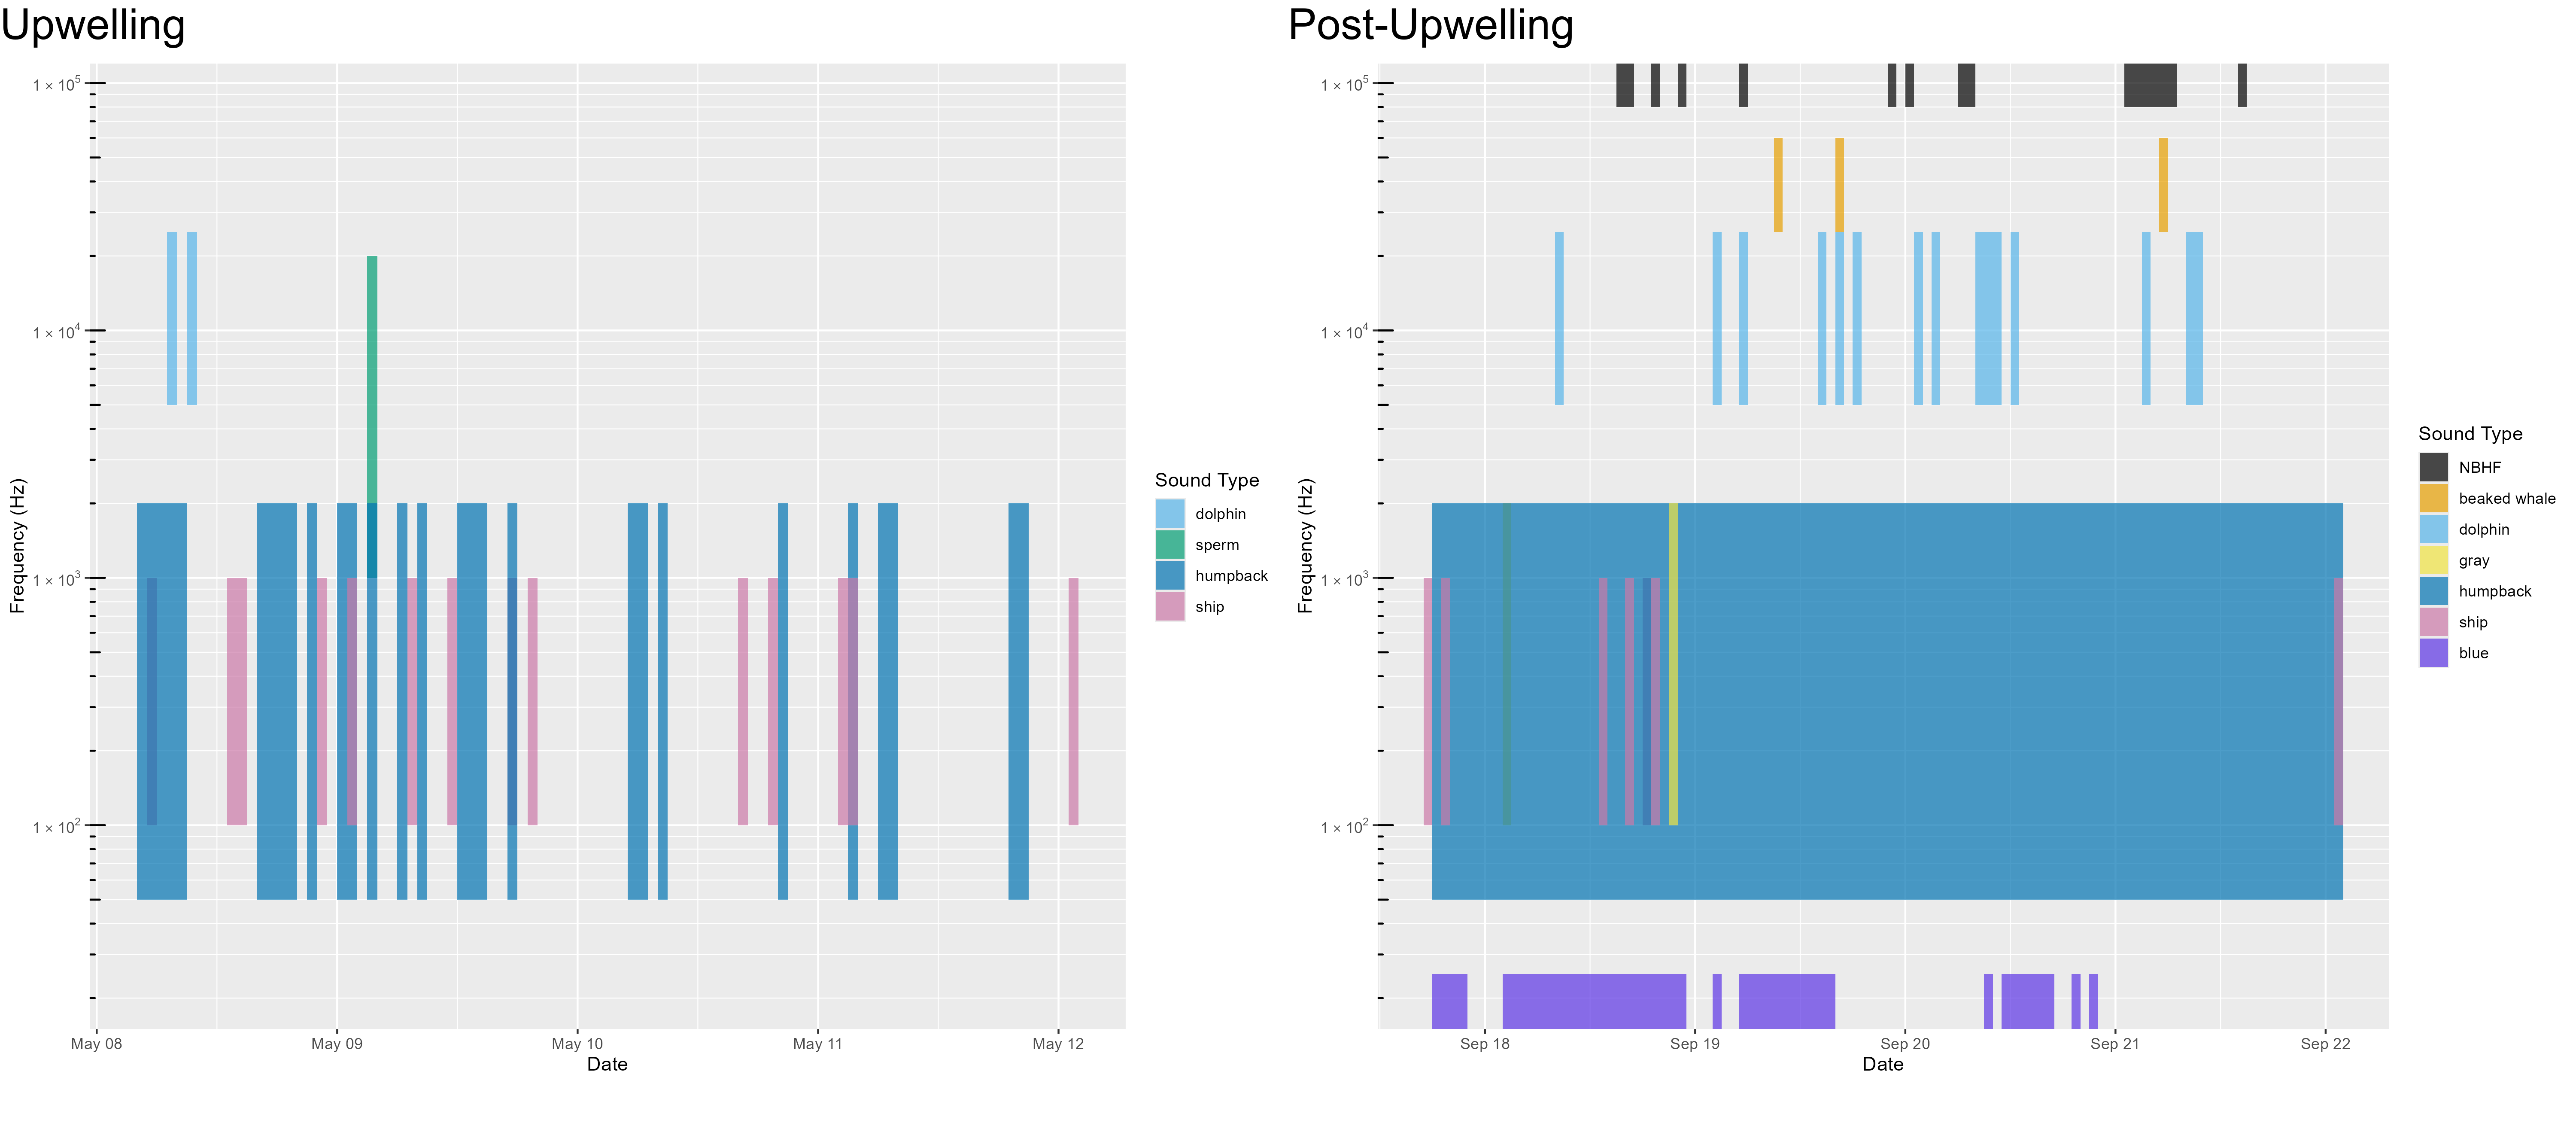
The 2023 Oregon Pilot study consisted of multiple deployments during the upwelling and post-upwelling season (Figure 1). NBHF and sperm whales were detected during both the upwelling and post-upwelling seasons, but they were not detected during all deployments. Dolphins were detected during all deployments during both seasons, with variable occurrence. There was a single detection of beaked whales during the upwelling season.
Fin, humpback, and gray whales were detected during both the upwelling and post-upwelling seasons off Oregon, with a few detections of blue whales during the post-upwelling season (Figure 1). While ship noise was detected during both seasons, detection of vessel noise varied by deployment.
There were no deployments during the winter oceanographic season in Oregon, and the single year study did not allow us to assess annual variation.
Humboldt
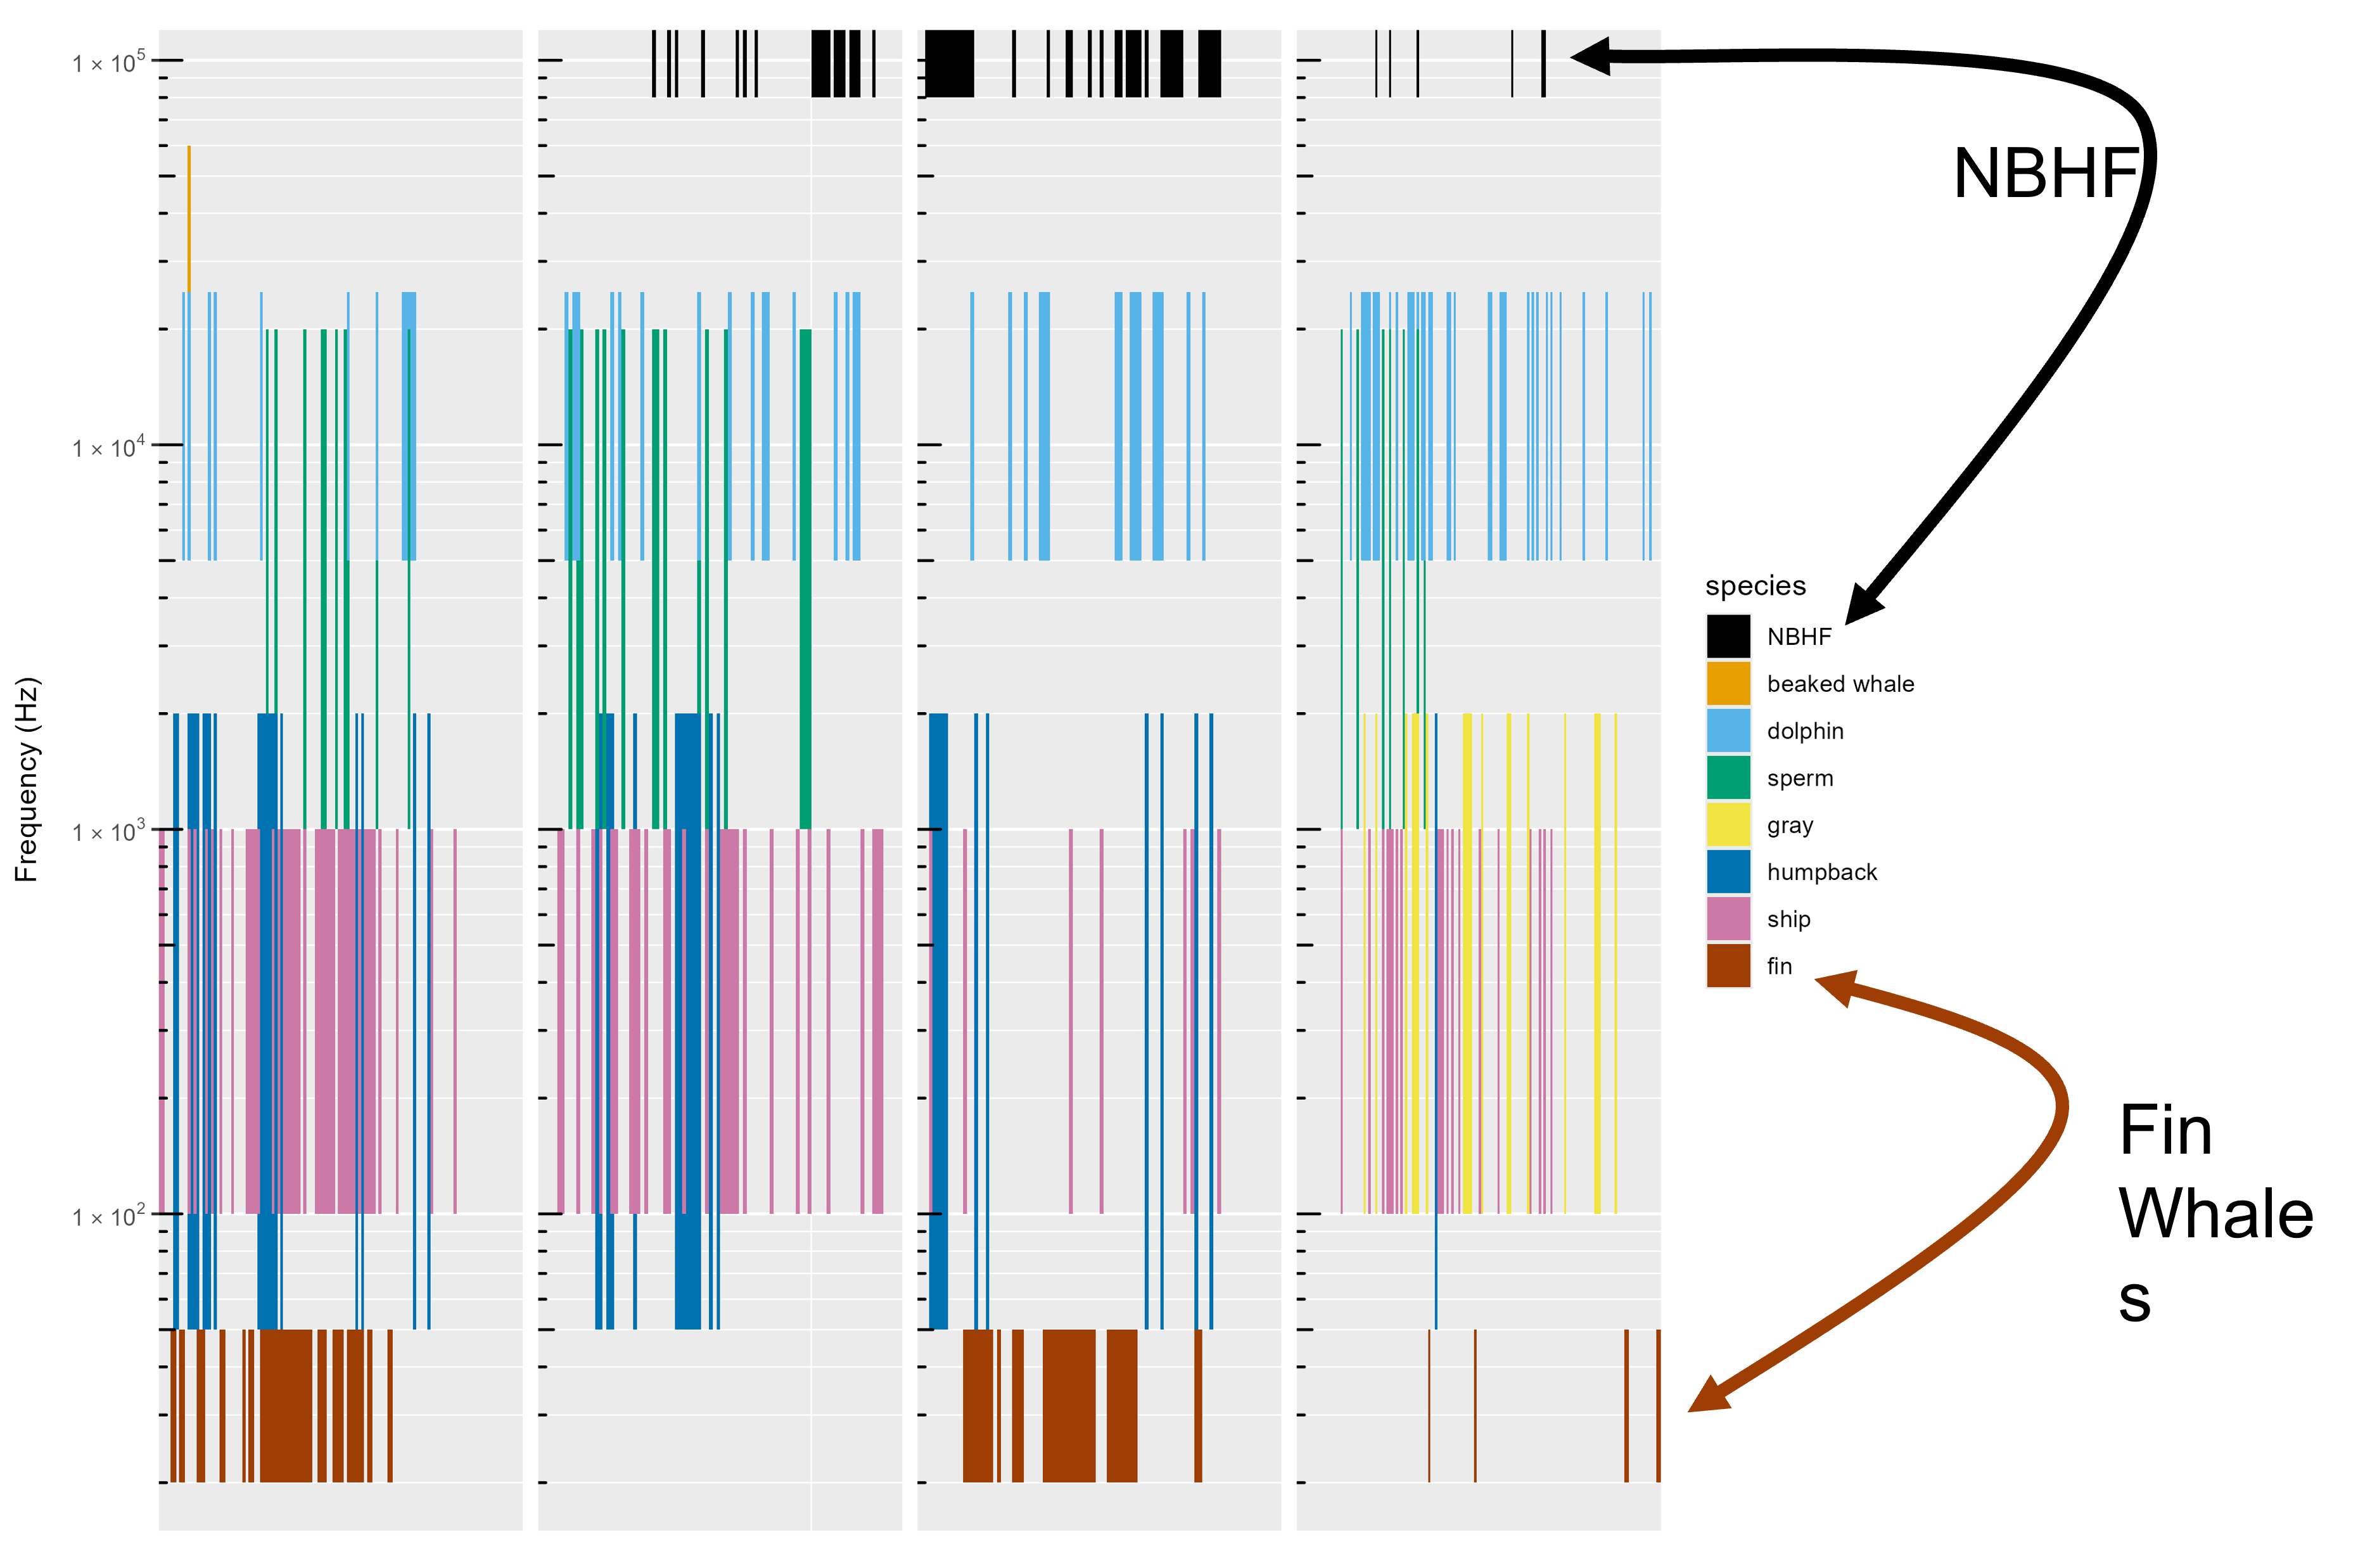
In Humboldt, NBHF, dolphins, and sperm whales were detected during all seasons, but not during all deployments (Figure 2, Figure 3, Figure 4). There were fewer dolphins detected in 2021 Figure 2) than in subsequent years. Similar to Oregon, there were few detections of beaked whales in this region.
Blue whales were consistently detected during the post-upwelling season in all years (Figure 2, Figure 3, Figure 4). While fin whales were detected in all seasons, they were most consistently detected in the post-upwelling season. Humpback whales were frequently detected across seasons and years.
There was little ship noise detected during 2021 (Figure 2), which may be due to the ongoing pandemic; ship noise was more consistent during the 2022 and 2023 deployments (Figure 3, Figure 4).
San Francisco
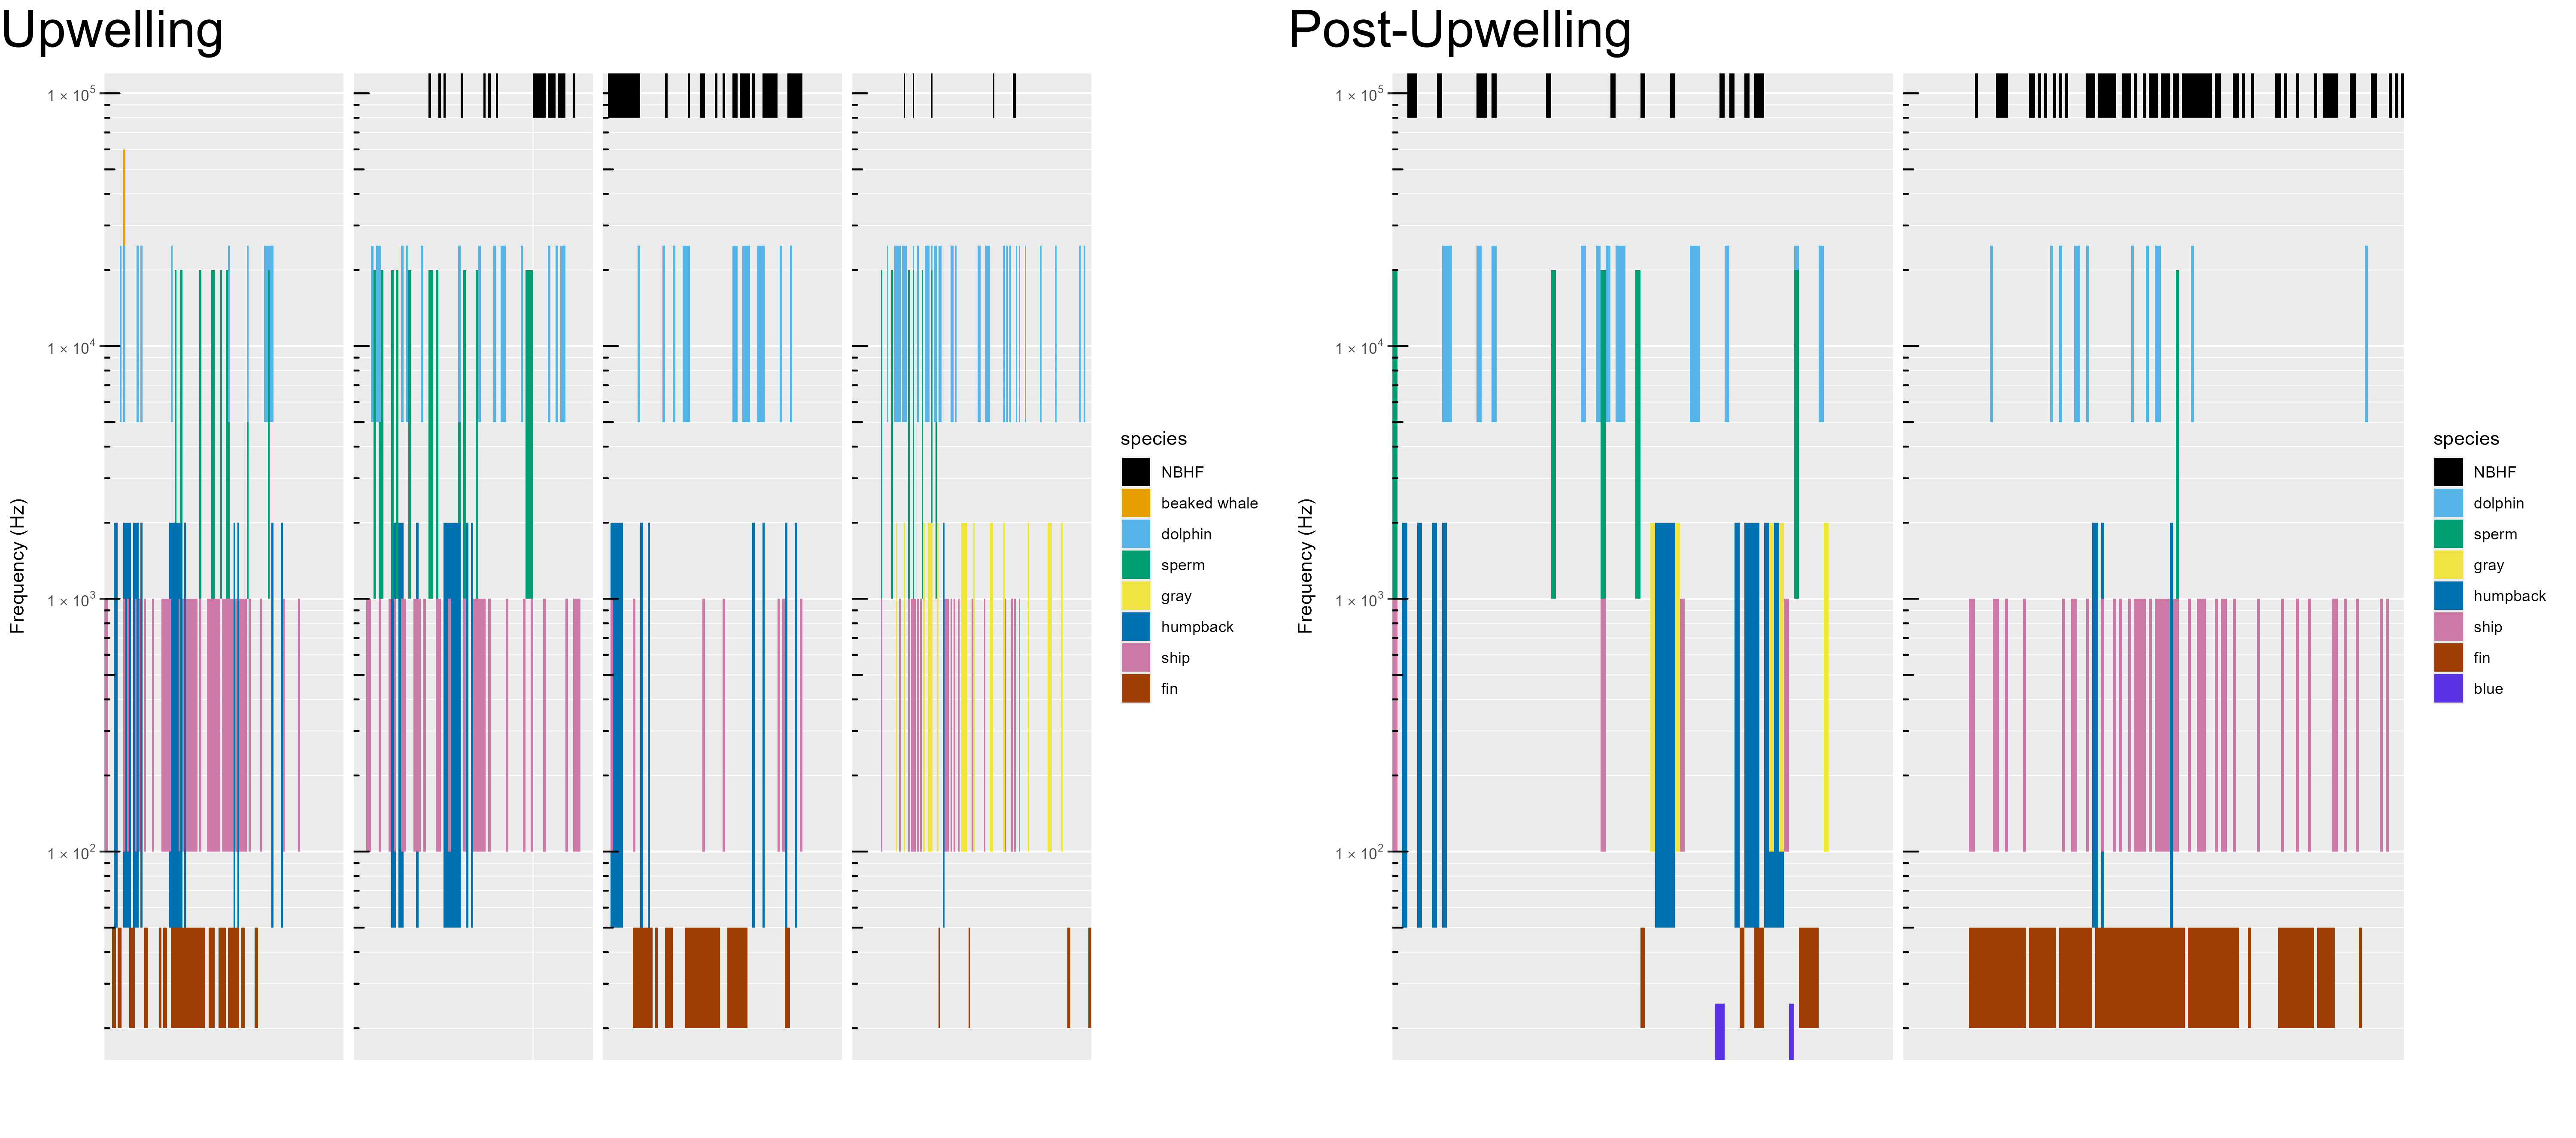
Deployments offshore San Francisco were coordinated with NOAA Sanctuaries’ ACCESS Surveys during the upwelling and post-upwelling oceanographic seasons (Figure 6, Figure 6, Figure 7). Contrary to other deployments, buoys were not deployed in clusters as part of the ACCESS survey (to broaden survey area), and therefore data represent data from 1 or 2 buoys at greater distance from each other. Differences in geographic location of deployments in the upwelling and post-upwelling seasons may complicate interpretation of seasonal differences in marine mammal detections (see Study Area: Adrift Drift Map).
Detection of odontocetes (including NBHF, beaked whales, sperm whales, and dolphins) varied by drift (Figure 6, Figure 6, Figure 7). Detection of baleen whales (humpback, gray, fin, and blue whales) varied by drift, with a general increase in detections of many baleen whale species during the post-upwelling season.
Despite the drift locations being near a convergence of shipping lanes entering San Francisco Bay, detection of specific vessels was relatively modest. Analysts noted an overall high level of ambient noise associated with background ship noise (see Ship Noise: Ship Hourly Presence Plot) and a reduced ability to detect individual vessels. Detection of vessels used manual detection methods (existing automated vessel detectors were not reliable for this dataset); development of a standardized vessel detector that works across datasets could be used to determine if individual ship tracks are difficult to detect in high traffic areas.
Morro Bay
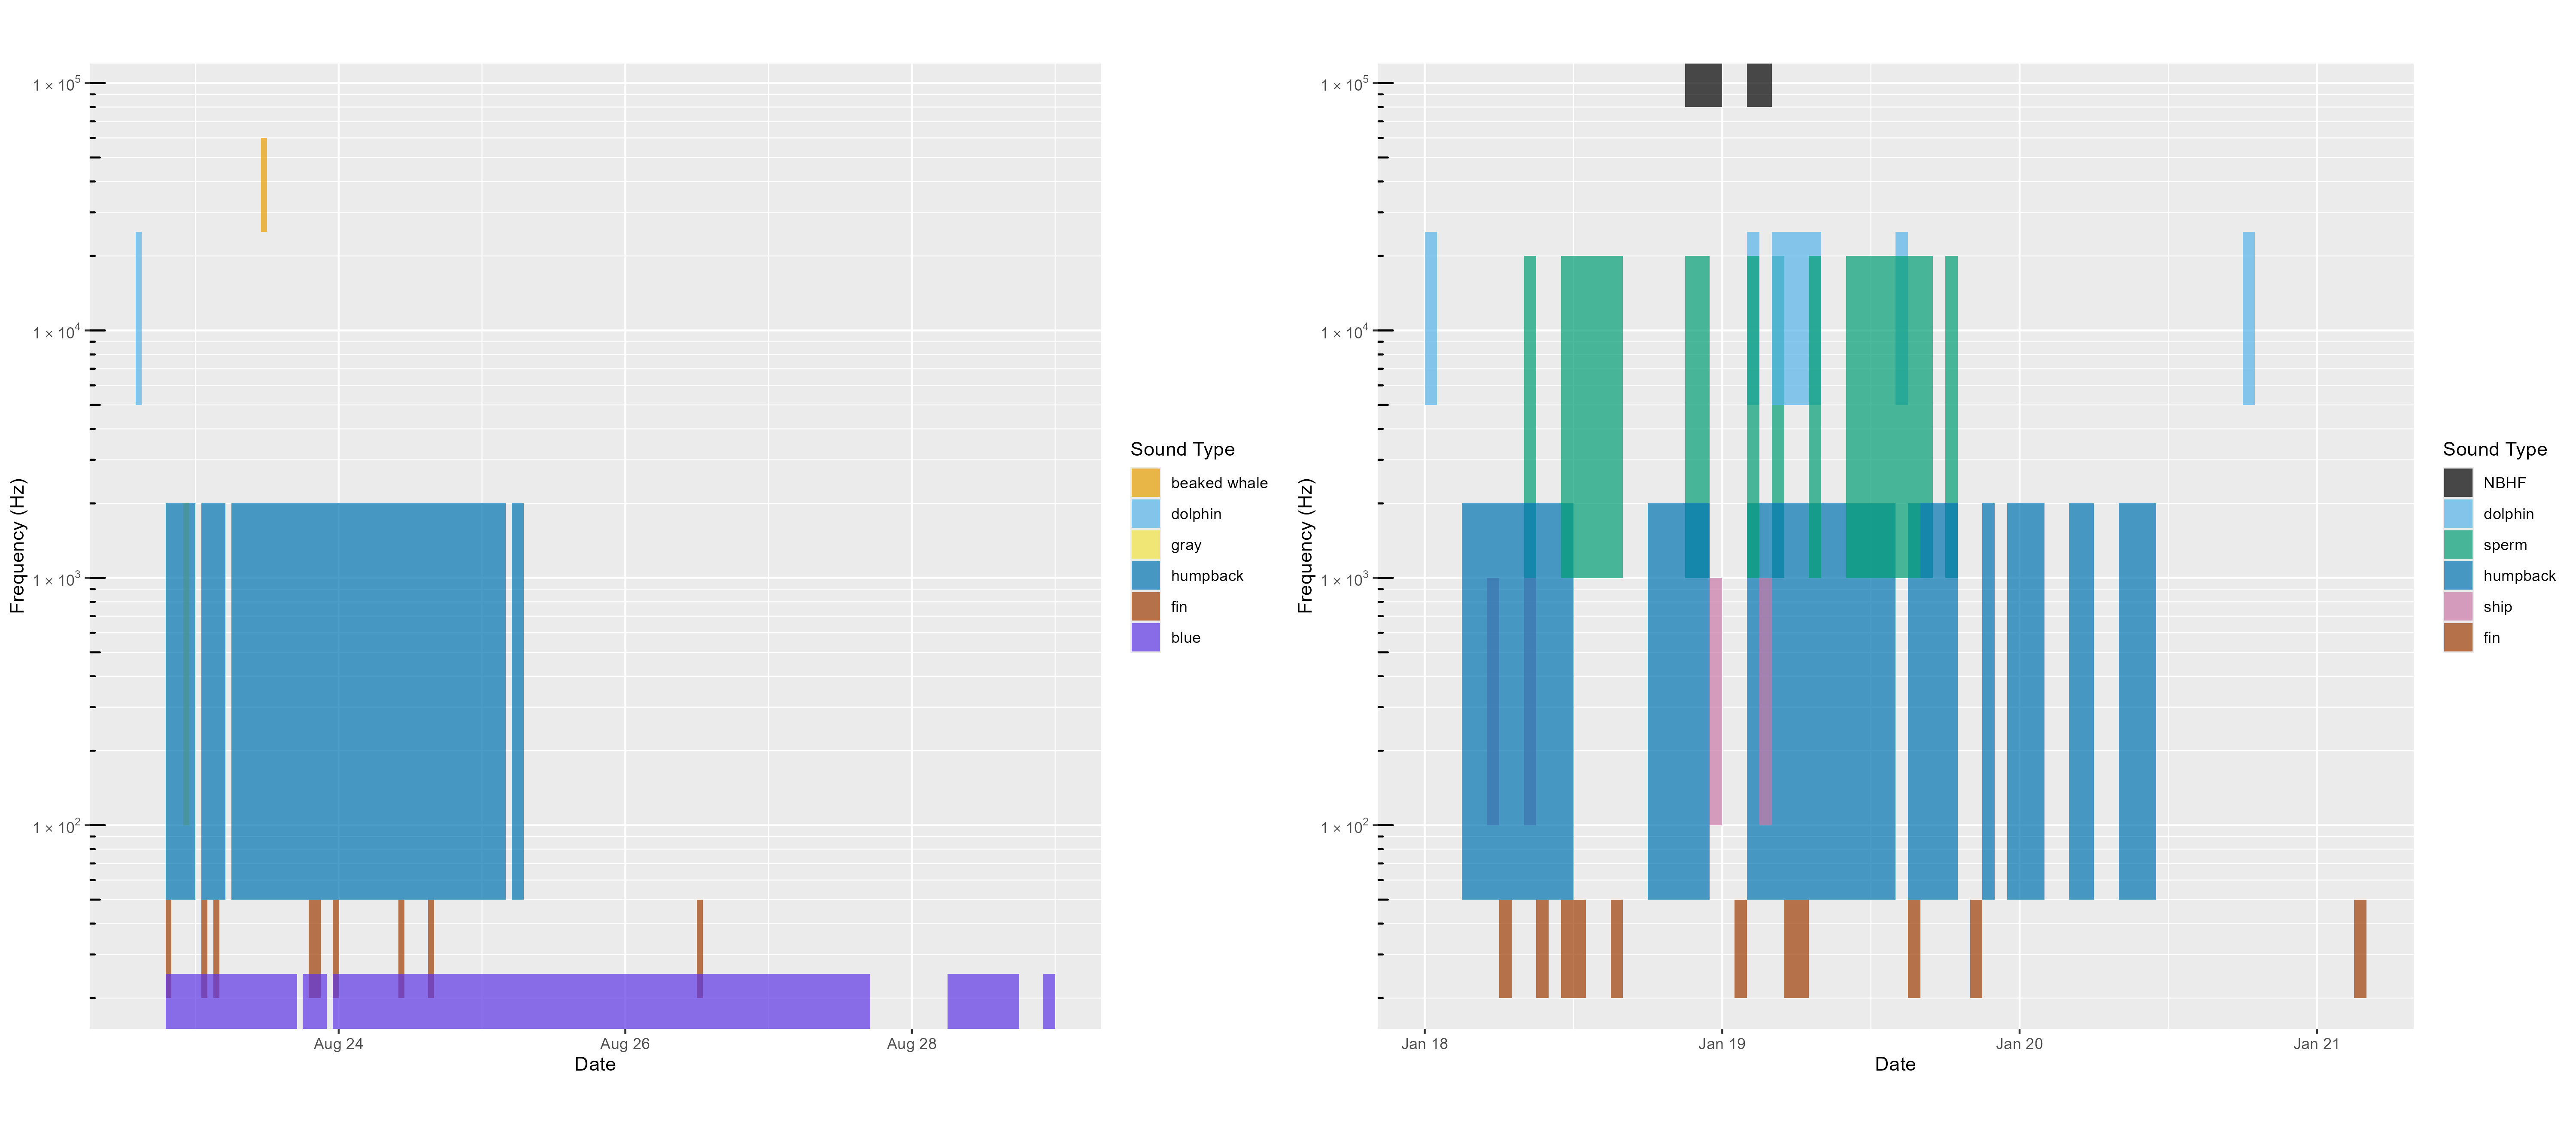
Morro Bay deployments included between 7 and 8 drifting recorders deployed over a larger area, which allowed for improved geographic sampling during the limited time for each deployment. Detection of NBHF, beaked whales, and dolphins were much lower during the initial upwelling deployments in 2022 (Figure 8), but high during the second upwelling deployments in 2022 and in the 2023 deployments. Detection of high numbers of beaked whales during times with dolphin echolocation was possible due to the vertical hydrophone configuration that allows for differentiating deep diving beaked whale species (echolocating below the hydrophones) from dolphins echolocating near the surface. Sperm whales were detected on some, but not all, drifts during both the upwelling and post-upwelling surveys (Figure 8, Figure 9).
Fin and humpback whales were detected during all surveys. Blue whales dominated the post-upwelling deployments in 2023 (Figure 9), but there were no blue whale detections during either of the upwelling deployments. Periodic vessel noise was detected during all deployments.