Ship Noise
Ships produce different sounds while operating, such as impulsive signals from ship propeller cavitation or echosounder signals that can be easily identified in the LTSA and confirmed with a spectrogram. Vessel noise was identified by a trained analyst scanning 1-hour LTSA windows (detailed methods provided in Adrift Analysis Methods).
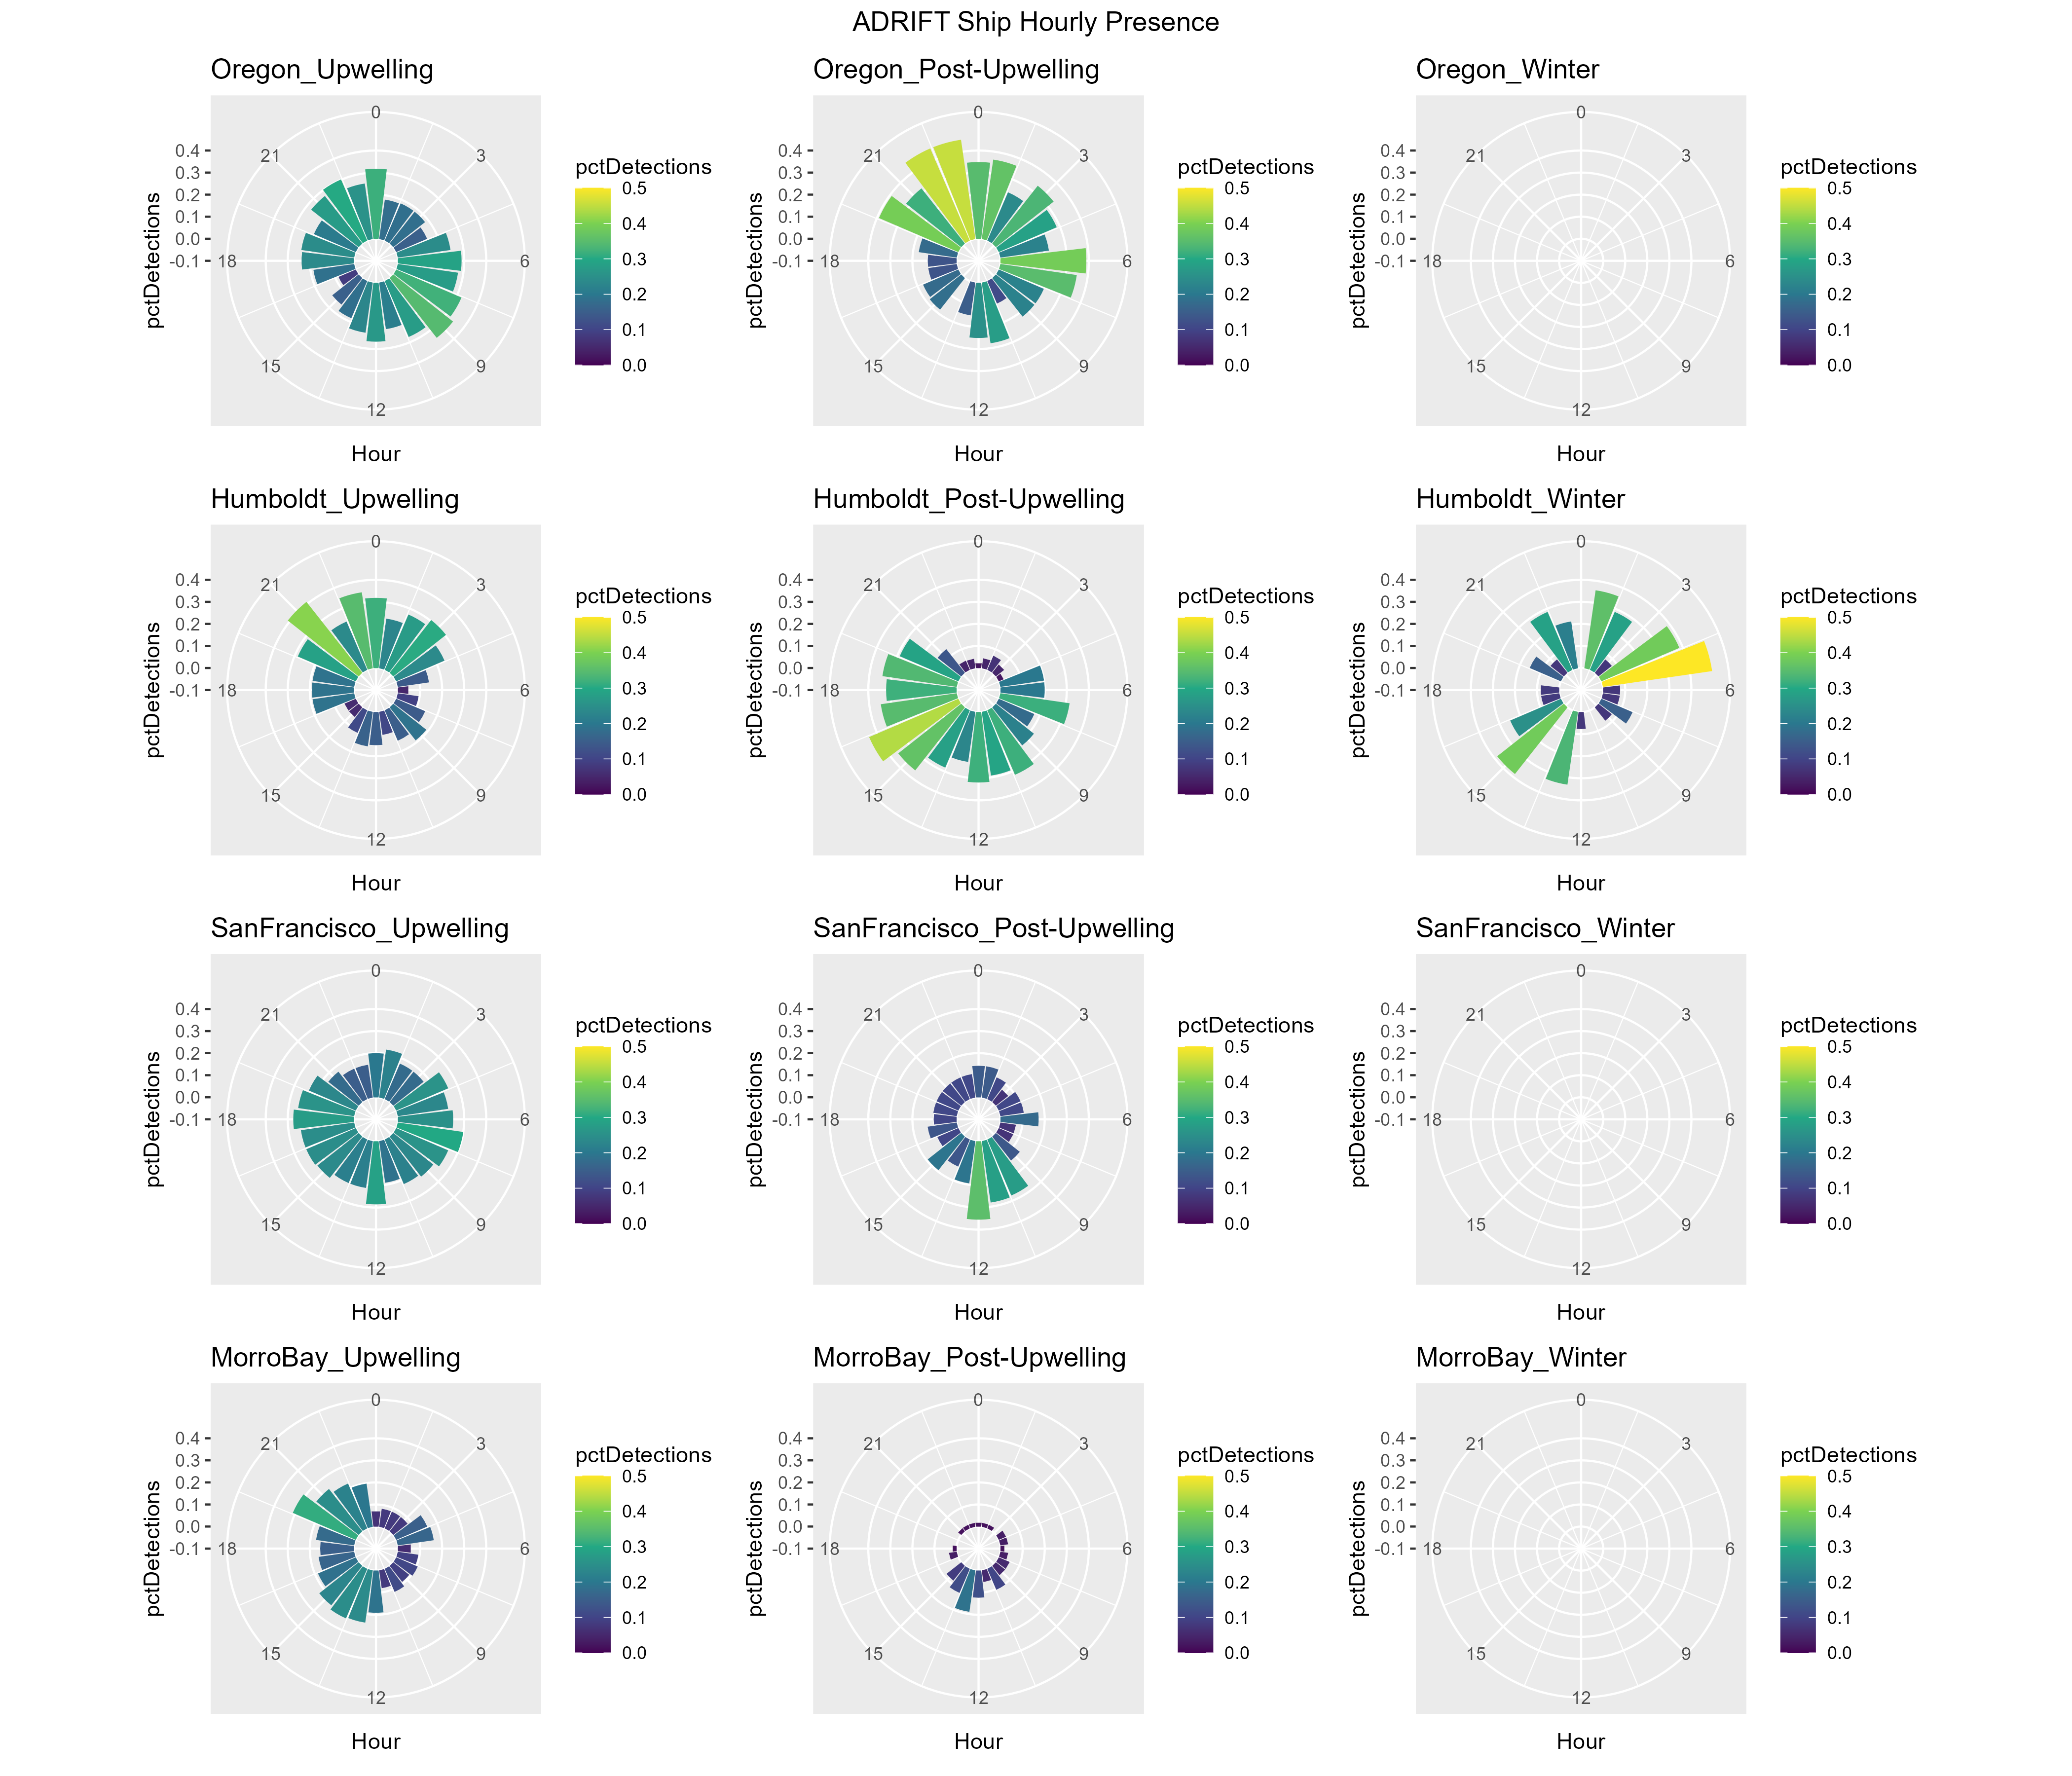
The percent of recording hours with vessel presence varied across region, season, and time of day (Figure 1). Vessel presence was higher in Oregon and Humboldt than in San Francisco or Morro Bay. Vessel presence in Humboldt shifted from night-time during the upwelling season to daytime during the post-upwelling season (summer), with winter variability likely relating to low effort. Morro Bay region experienced the lowest amount of vessel traffic, with extremely low levels of vessel traffic (<20%) detected in the post-upwelling season.
Hourly presence of ships in San Francisco appears to be lower than other regions (Figure 1). Overall sound levels were much higher in this region (see Adrift PSD Plot in Soundscapes), and may have masked some individual ship passages. Future work can include an Automatic Identification System metric such as the number of unique large vessels with relatively close approaches.
The manual methods used in this study were time consuming, but our initial efforts to analyze data with an existing ship detector found that the detector was unreliable on identifying ship tracks with our dataset. We recommend development of an open-source approach to vessel detection that includes classification of vessels to vessel type, and integration of this data into a systematic approach to quantifying the contribution of ship noise to the soundscape.