Sperm Whale Demographics
Determining Sperm Whale Demographic Composition using Inter-Click Intervals
Male and female sperm whales are sexually dimorphic and differences in body size (males are larger than females) have been linked to differences in echolocation click characteristics (Solsona-Berga et al. 2022). The Inter-Pulse Interval (IPI) is a result of the time taken for the click to reflect multiple times between air sacs at opposite ends of the spermaceti organ and to exit the rostrum in several subsequent pulses (Møhl et al. 2000), and thus the IPI has been found to relate to body size. Similarly, the Inter-Click Interval (ICI), which is the time between pulse trains, can serve as a proxy for sperm whale body size and sex, as males click every ~1s and females click every 0.5s (Solsona-Berga et al. 2022). This pilot study investigated the potential for assessing demographic composition of sperm whales in the California Current using inter-click interval as a proxy for sex/size in acoustic data from six drifting buoys.
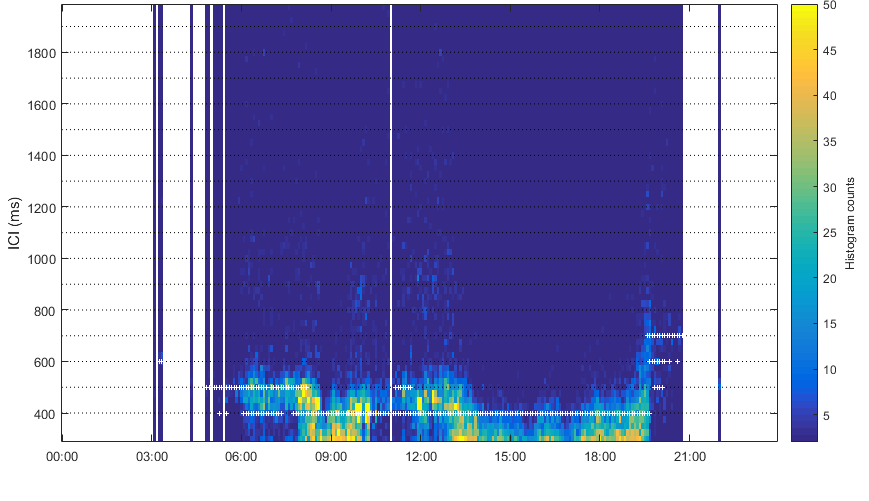
Sperm whale echolocation clicks were detected using the multi-step approach described in (Solsona-Berga et al. 2022) appendix, with manual review of putative sperm whale acoustic encounters using DetEdit. Histograms of ICI provide a visualization to indicate sperm whale size and sex (Solsona-Berga et al. 2022). A plot of concatenated histograms, referred to as ICIgrams, was annotated and categorized for each time period at each site (see Figure 1). Detections with a modal ICI of 600 ms or less were presumed to be females and their young, or Social Groups. Detections with a modal ICI of 0.8 s and greater will be considered Adult Males. The detections with a modal ICI between the Social Groups and Adult Males (< 0.6 s and > 0.8 s) could contain large females or juvenile males, and will be referred to as Mid-Size.
The ICIgram method was originally developed for sperm whales in the Gulf of Mexico (Solsona-Berga et al. 2022), and has been applied to sperm whales in the Gulf of Alaska (Posdaljian et al. 2023) and in southern New England (Westell et al. 2024). To compare how effectively the ICIgram method can be used to categorize the size/sex of sperm whales in the California Current, length estimates using IPI from individual animals were matched with the size/sex classification using the ICIgram method.
IPIs were extracted using the Cachalot Automatic Body Length Estimator (CABLE) (Beslin, Whitehead, and Gero 2018). This tool estimates the body length of sperm whales by compiling and clustering their IPI distributions. To avoid including the same animal more than once, only unique IPI values were retained in the final analysis.
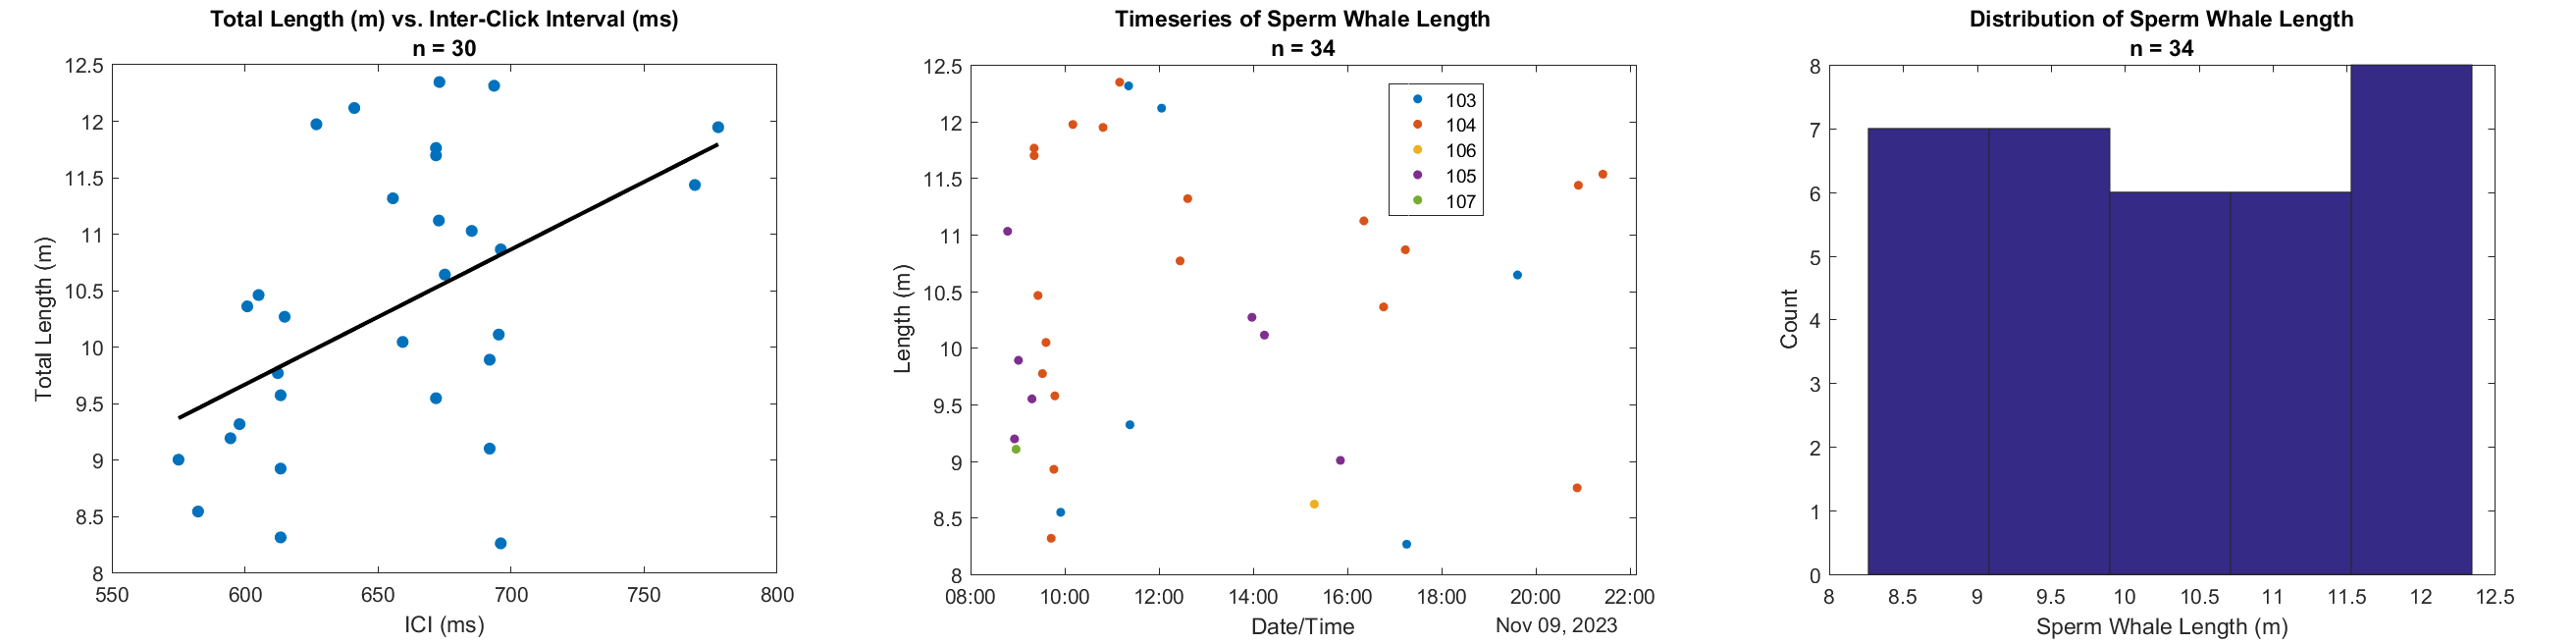
The results of this pilot study identified only one size/sex class (Social Groups) based on their echolocation ICI, supported by examining IPI for individual clicks. Sperm whale body length estimates were calculated using both their IPI and ICI for 34 animals encountered across six Adrift study deployments. The animal lengths obtained from the IPI were plotted against the ICI to confirm the linear relationship between the two acoustic characteristics (Figure 2, left). A Thiel-sen regression revealed a slope between ICI and body length suggesting a 1.2 m increase in size associated with a 100 ms increase in ICI (line of best fit: body length = 0.0120*ICI + 2.5, R2 = 0.4, p-value = 0.02: Spearman’s correlation coefficient). No ICIs above 800 ms and total body length above 12.3 m were identified, indicating that only Social Groups with potentially a few subadult males were detected. The Adrift study data suggested a steeper linear relationship between ICI and total length compared to (Solsona-Berga et al. 2022), likely because the Adrift study data only included 34 animals and these were all females and their young with potentially a few subadult males.
This pilot study investigated the potential for assessing demographic composition of sperm whales in the California Current using inter-click interval as a proxy for sex/size in acoustic data from a subset of six drifting recorders. A total of 34 animals with a mean total body length of 10.3 m, likely Social Groups and Mid-Size animals, were identified in the region on November 9th, 2023. By applying this method to the entire dataset, we can further understand the demographics of sperm whales utilizing the California Current and potentially identify regions preferred by different demographic groups (i.e., Social Groups, Mid-Size, and Adult Males). Different demographic groups have differences in behavior and ecology that likely translate to demographic-specific responses to increasing anthropogenic threats and climate change. This type of analysis can play an important role for monitoring future changes to sperm whales in the California Current.