Humpback Whales

Humpback whales were detected during most deployments (Figure 1), with higher probability of detection in the post-upwelling season in Humboldt and San Francisco (see table, right). Hourly detection rates of humpback whales were lower for the combined PASCAL and CCES surveys than the Adrift study (Figure 1). Most PASCAL and CCES deployments were further offshore (west) of the Adrift study areas (see drift maps in PASCAL Expanded Datasets and CCES Expanded Datasets). Historical sighting data shows decreased distribution of humpback whales in these offshore waters (see OBIS Seamap). Humpback whales were not detected in Oregon during the PASCAL and CCES Surveys (Figure 1).

There were few acoustic detections of humpback whales during the late June/early July surveys off Morro Bay (Figure 1).

Upwelling Post-Upwelling Winter
Song
Oregon 0.03 (1430)  0.00 (493)   – (–)
Humboldt 0.13 (489)   0.42 (1048)  0.58 (308) 
San Francisco 0.03 (960)   0.36 (688)   – (–)
Morro Bay 0.40 (2034)  0.24 (1353)  – (–)
Social
Oregon 0.01 (1430)  0.04 (493)   – (–)
Humboldt 0.01 (489)   0.16 (1048)  0.00 (308) 
San Francisco 0.01 (960)   0.24 (688)   – (–)
Morro Bay 0.02 (2034)  0.02 (1353)  – (–)
Unidentified
Oregon 0.03 (1430)  0.01 (493)   – (–)
Humboldt 0.15 (489)   0.26 (1048)  0.18 (308) 
San Francisco 0.06 (960)   0.28 (688)   – (–)
Morro Bay 0.16 (2034)  0.21 (1353)  – (–)

Multiple humpback whales were visually sighted during the June 2022 and July 2023 CCC surveys in Morro Bay; however, the bulk of the visual survey effort (and sightings) were south of the area acoustically surveyed. The disconnect between the visual sightings and acoustic detections could be due to local differences in the sampling areas or that the animals were not particularly vocal during this sampling period.
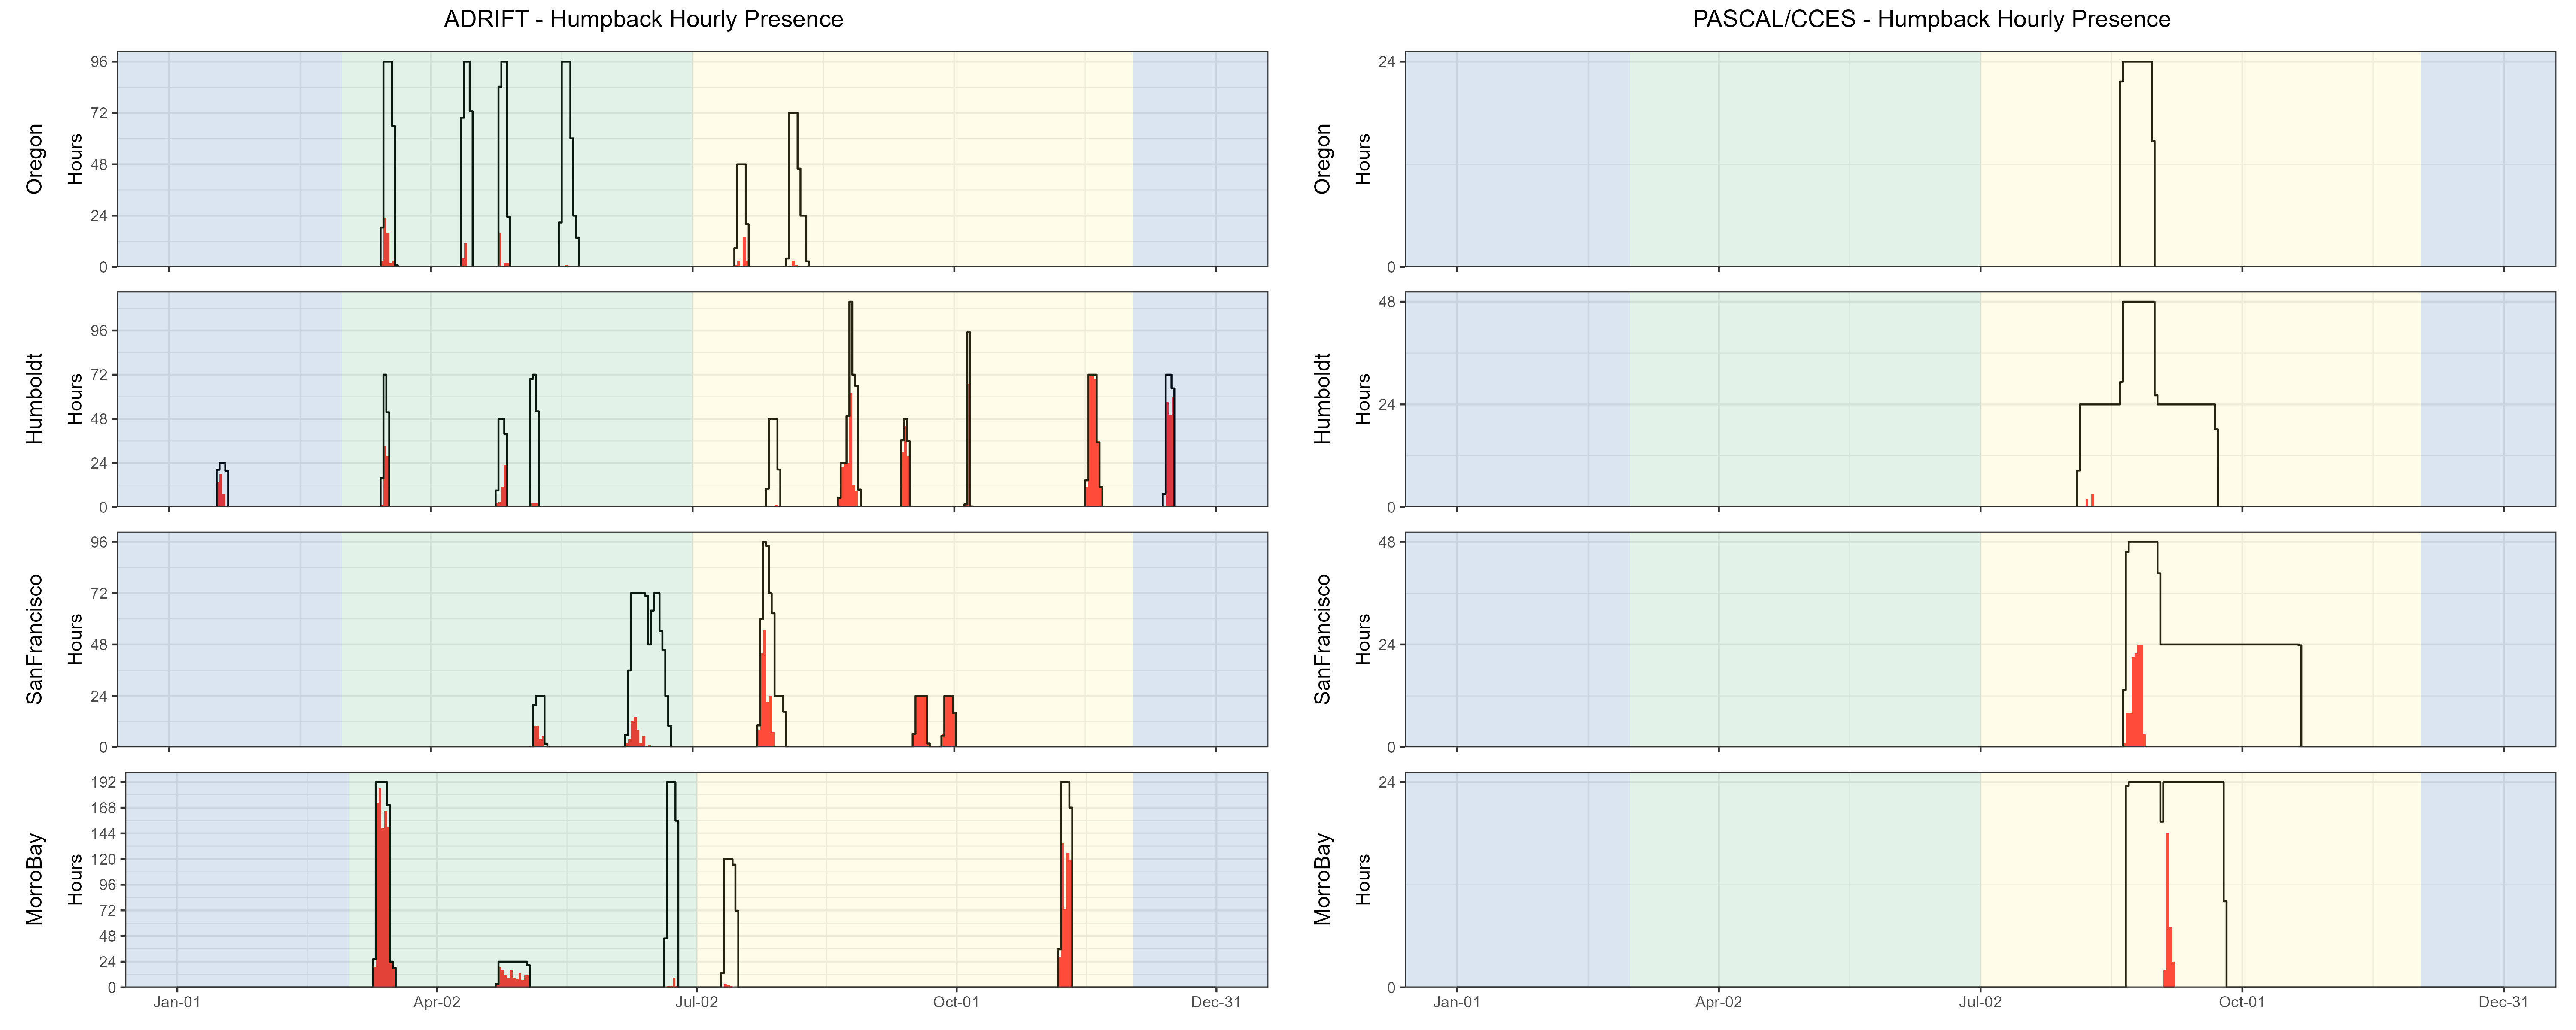
Hourly presence of humpback whales detected during the Adrift study (left graph) and the combined PASCAL/CCES surveys (right graph). Detections in Oregon are shown in the top graphs, then Humboldt, San Francisco, and Morro Bay at the bottom. The number of hours is provided on the y-axis, and the date on the x-axis, with seasons shaded in blue for winter, green for upwelling, and yellow for the post-upwelling season. Effort is outlined with a black line, and hours of effort with detections are highlighted in red. Detection of humpbacks varied by drift, with fewer detections off Oregon for all surveys. Humpback whale detections were strong off Humboldt for most drifts during Adrift, but there were few humpback detections in Humboldt (and Oregon) for the PASCAL/CCES surveys.

Figure 1: Hourly humpback whale events by month, region for Adrift and combined PASCAL, CCES surveys. Hourly presence of combined humpback whales call types (y axis) for different months for combined years (x axis) and for each region (Oregon, Humboldt, San Francisco, and Morro Bay) for Adrift (left) and combined PASCAL and CCES (right). Hourly presence for duty-cycled data relates to the portion of the hour included in the duty cycled data. Black lines represent total available hours (effort) and red lines represent hours with detections. Blue shading represents winter, green represents upwelling, and yellow represents the post-upwelling oceanographic season.

Hourly probability of detecting song was higher in the post-upwelling than the upwelling season for Humboldt and San Francisco, but the opposite was true for Morro Bay (see table, above). Deployments were limited in winter, but high probability of detecting humpback song aligns with the production of song during the southern winter migration (Clapham and Mattila 1990). There were several drifts in which humpback song dominated the recordings (Figure 2). The acoustic features of humpback whale song, including high source level and series of calls produced over long time spans, naturally lead to high detection rates (Au et al. 2006). While recordings dominated by song may be attributed to one or a few animals, social sounds may be attributed to larger numbers of animals (Ryan et al. 2019). There were few detections of humpback song in Oregon.
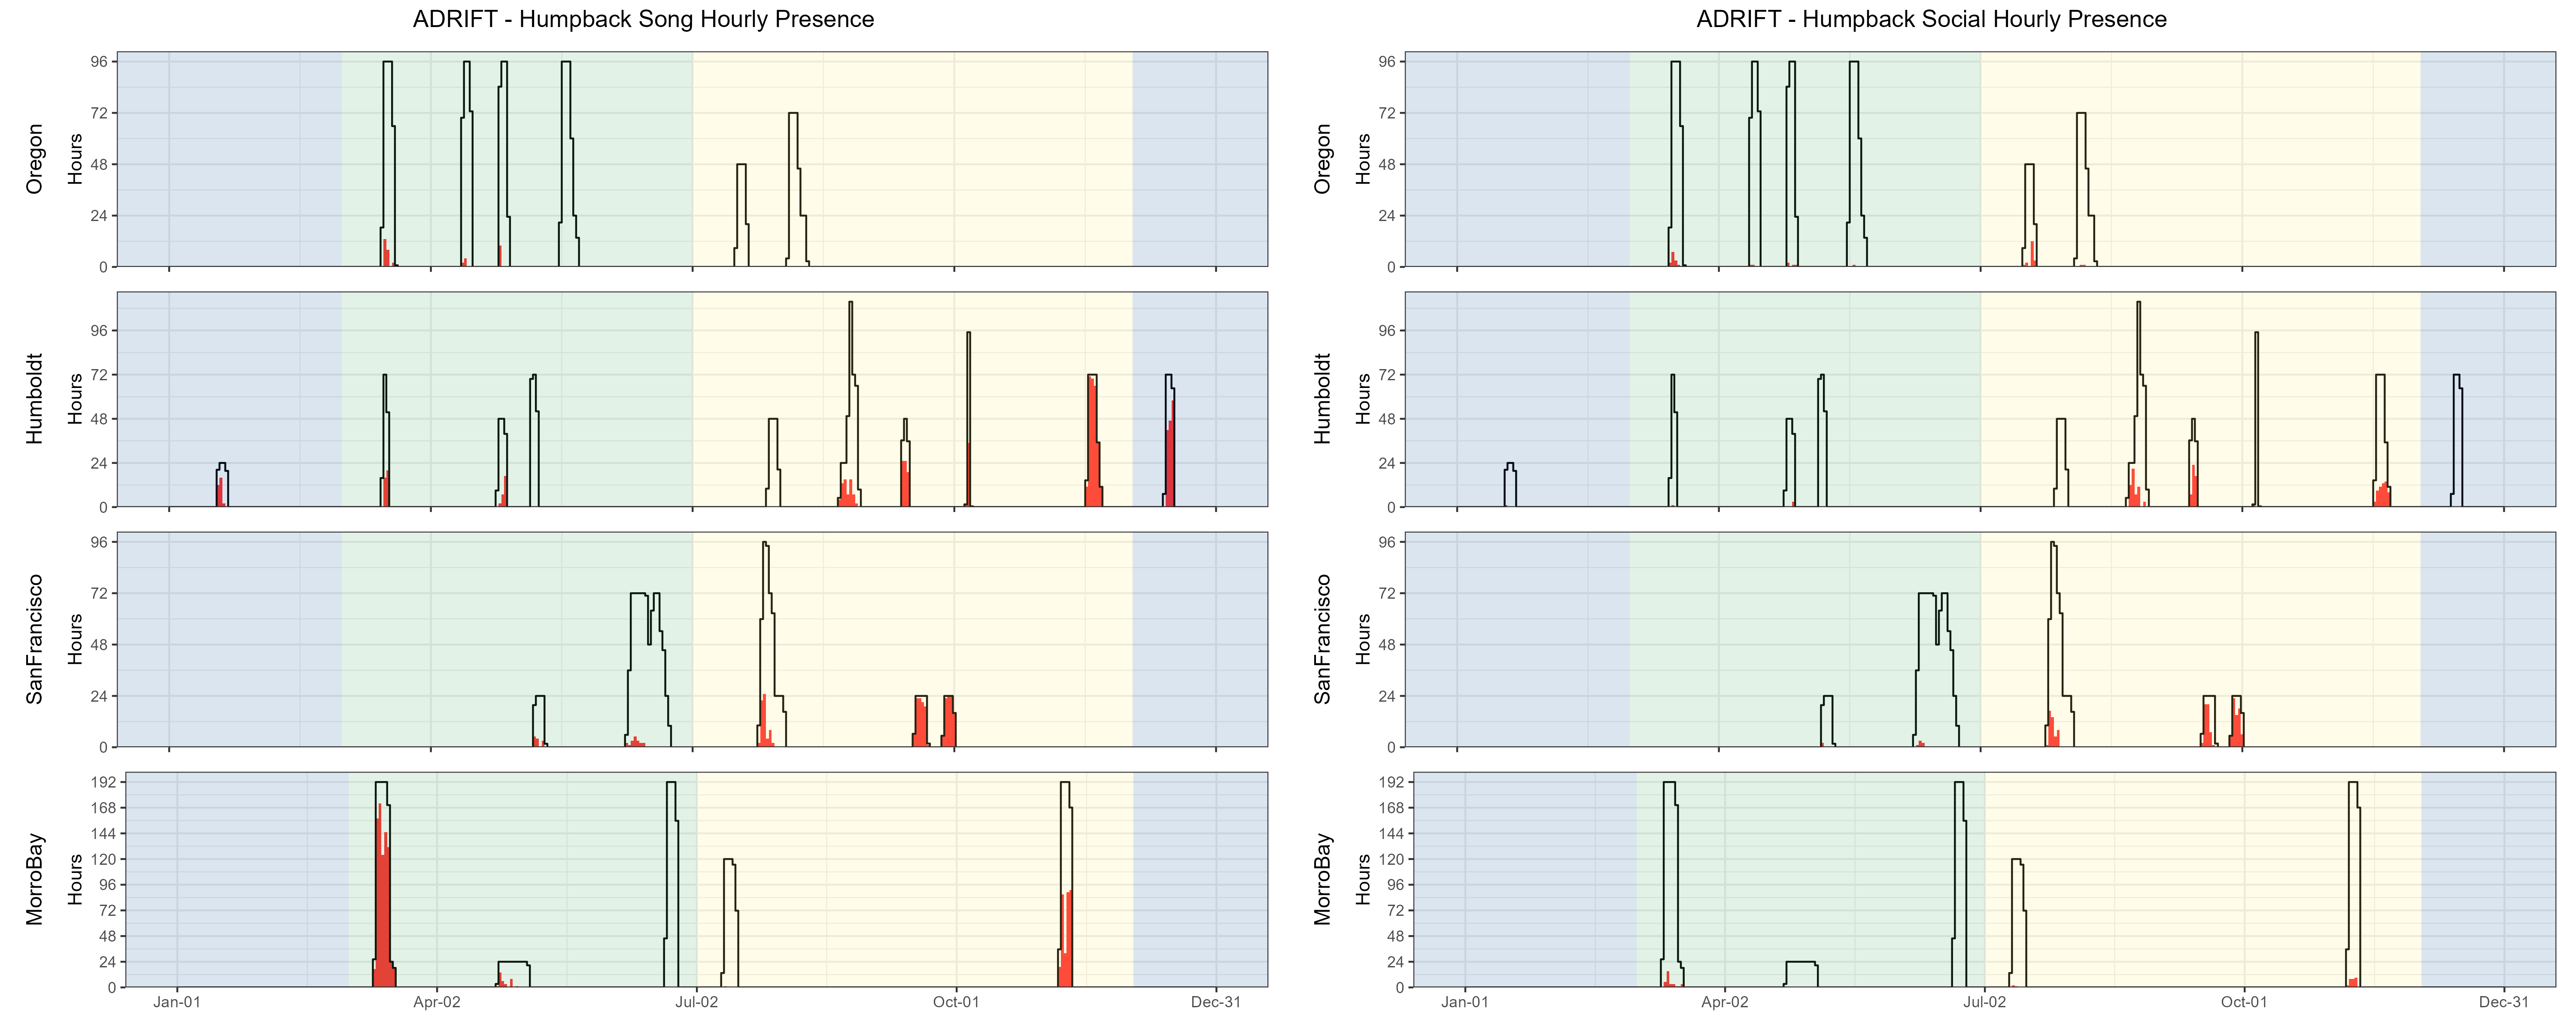
Hourly presence of humpback whale song detected during the Adrift study (left graph) and social calls (right graph). Detections in Oregon are shown in the top graphs, then Humboldt, San Francisco, and Morro Bay at the bottom. The number of hours is provided on the y-axis, and the date on the x-axis, with seasons shaded in blue for winter, green for upwelling, and yellow for the post-upwelling season. Effort is outlined with a black line, and hours of effort with detections are highlighted in red. Humpback song and social calls were stronger during the post-upwelling drifts deployed off Humboldt and San Francisco. Detection of humpback social calls mirrored detection of song in all regions except Morro Bay, where there were few detections of humpback social calls.

Figure 2: Hourly presence of humpback song, social calls by month, region for Adrift. Hourly presence of humpback song (left) and humpback social calls (right)(y axis) for different months for combined years (x axis) and for each region (Oregon, Humboldt, San Francisco, and Morro Bay). Adrifts 001-012 were duty cycled and hourly presence relates to the portion of the hour included in the duty cycled data (6 min of 12 min). Black lines represent total available hours (effort) and red lines represent hours with detections. Blue shading represents winter, green represents upwelling, and yellow represents the post-upwelling oceanographic season.

Humpback whales produce many non-song (social) calls that may be associated with feeding or social behaviors.  Humpback whale social sounds most frequently detected in these analyses included the grunts, ‘wops’ and ‘thwops’ (Dunlop, Cato, and Noad 2008). We were unable to dedicate the time required to differentiate these sounds during this study. Highly annotated datasets exist, and we recommend development of machine learning models to classify humpback non-song, which may allow for an improved understanding of spatial and temporal variation in habitat use in the California Current, allowing us to identify potential critical habitat. 

Detailed methods are provided in our Adrift Analysis Methods.

References

Au, Whitlow W. L., Adam A. Pack, Marc O. Lammers, Louis M. Herman, Mark H. Deakos, and Kim Andrews. 2006. “Acoustic Properties of Humpback Whale Songs.” The Journal of the Acoustical Society of America 120 (2): 1103–10. https://doi.org/10.1121/1.2211547.
Clapham, P. J.hillip, and David K. Mattila. 1990. “Humpback Whale Songs as Indicators of Migration Routes.” Marine Mammal Science 6 (2): 155–60. https://doi.org/10.1111/j.1748-7692.1990.tb00238.x.
Dunlop, Rebecca A., Douglas H. Cato, and Michael J. Noad. 2008. “Non-Song Acoustic Communication in Migrating Humpback Whales (Megaptera Novaeangliae).” Marine Mammal Science 24 (3): 613–29. https://doi.org/10.1111/j.1748-7692.2008.00208.x.
Ryan, John P., Danelle E. Cline, John E. Joseph, Tetyana Margolina, Jarrod A. Santora, Raphael M. Kudela, Francisco P. Chavez, et al. 2019. “Humpback Whale Song Occurrence Reflects Ecosystem Variability in Feeding and Migratory Habitat of the Northeast Pacific.” PLOS ONE 14 (9): e0222456. https://doi.org/10.1371/journal.pone.0222456.