| Drift ID | Site | Status | Deployment | Retrieval | Recording Specifications | Data Start Date | Data End Date | |||||||
|---|---|---|---|---|---|---|---|---|---|---|---|---|---|---|
| Date | Latitude | Longitude | Date | Latitude | Longitude | Recorder | SR (kHz) | Duty Cycle | HP Depth (m) | |||||
| PASCAL_001 | ORE | Complete | 2016-08-19 | 44.35 | −125.31 | 2016-08-31 | 43.29 | −126.29 | ST4300 | 288 | 2 min per 10 | 100 | 2016-08-20 | 2016-08-31 |
| PASCAL_002 | HUM | Complete | 2016-08-21 | 41.49 | −125.36 | 2016-09-01 | 41.90 | −125.32 | ST4300 | 288 | 2 min per 10 | 100 | 2016-08-20 | 2016-09-01 |
| PASCAL_003 | MND | Complete | 2016-08-21 | 38.57 | −124.36 | 2016-09-02 | 38.08 | −124.03 | ST4300 | 288 | 2 min per 10 | 100 | 2016-08-21 | 2016-09-02 |
| PASCAL_004 | MBY | Complete | 2016-08-22 | 36.35 | −122.95 | 2016-09-03 | 36.05 | −122.68 | ST4300 | 288 | 2 min per 10 | 100 | 2016-08-22 | 2016-09-03 |
| PASCAL_005 | CHI | Complete | 2016-08-22 | 34.21 | −121.43 | 2016-09-04 | 33.99 | −121.72 | ST4300 | 288 | 2 min per 10 | 100 | 2016-08-22 | 2016-09-04 |
| PASCAL_006 | BCN | Complete | 2016-08-24 | 32.19 | −119.91 | 2016-09-12 | 32.61 | −119.50 | ST4300 | 288 | 2 min per 2 | 100 | 2016-08-24 | 2016-08-30 |
| PASCAL_007 | BCN | Complete | 2016-08-25 | 31.37 | −123.71 | 2016-09-13 | 30.24 | −122.39 | SM3M | 256 | Continuous | 100 | 2016-08-25 | 2016-09-13 |
| PASCAL_008 | CHI | Complete | 2016-08-26 | 33.76 | −125.92 | 2016-09-14 | 33.95 | −125.39 | SM2Bat | 192 | 2 min per 4 | 100 | 2016-08-26 | 2016-09-14 |
| PASCAL_009 | MBY | Complete | 2016-08-27 | 36.54 | −127.57 | 2016-09-15 | 36.99 | −128.64 | ST300 | 48 | 2 min per 2 | 100 | 2016-08-27 | 2016-09-15 |
| PASCAL_009 | MBY | Complete | 2016-08-27 | 36.54 | −127.57 | 2016-09-15 | 36.99 | −128.64 | ST4300 | 288 | 2 min per 10 | 100 | 2016-08-27 | 2016-09-15 |
| PASCAL_010 | MND | Complete | 2016-08-27 | 39.25 | −129.19 | 2016-09-16 | 39.18 | −129.76 | SM3M | 256 | Continuous | 100 | 2016-08-27 | 2016-09-17 |
| PASCAL_011 | ORE | Complete | 2016-08-28 | 42.24 | −129.85 | 2016-09-17 | 42.79 | −129.87 | SM2Bat | 192 | 2 min per 4 | 100 | 2016-08-28 | 2016-09-17 |
| PASCAL_012 | COL | Complete | 2016-08-29 | 45.26 | −129.78 | 2016-09-17 | 45.37 | −129.07 | ST4300 | 288 | 2 min per 10 | 100 | 2016-08-29 | 2016-09-17 |
| PASCAL_013 | COL | Complete | 2016-08-29 | 46.23 | −127.61 | 2016-09-18 | 46.33 | −128.11 | SM3M | 256 | 2 min per 2 | 100 | 2016-08-29 | 2016-09-15 |
| PASCAL_014 | WAS | Unusable | 2016-08-30 | 47.11 | −125.61 | 2016-09-18 | 47.11 | −125.38 | SM2Bat | 192 | 2 min per 4 | 100 | 2016-08-30 | 2016-09-18 |
| PASCAL_015 | ORE | Complete | 2016-08-31 | 43.68 | −127.74 | 2016-09-16 | 41.64 | −129.28 | ST4300 | 288 | 2 min per 2 | 100 | 2016-08-31 | 2016-09-05 |
| PASCAL_016 | HUM | Complete | 2016-09-01 | 40.81 | −127.54 | 2016-09-20 | 39.43 | −127.61 | ST4300 | 288 | 2 min per 10 | 100 | 2016-09-01 | 2016-09-21 |
| PASCAL_017 | PTA | Complete | 2016-09-02 | 38.52 | −126.64 | 2016-09-21 | 36.51 | −124.62 | SM3M | 256 | Continuous | 100 | 2016-09-02 | 2016-09-21 |
| PASCAL_018 | MBY | Complete | 2016-09-03 | 35.84 | −124.92 | 2016-09-22 | 34.38 | −124.52 | SM2Bat | 192 | 2 min per 4 | 100 | 2016-09-03 | 2016-09-22 |
| PASCAL_019 | CHI | Complete | 2016-09-04 | 33.22 | −123.16 | 2016-09-23 | 31.83 | −122.06 | ST4300 | 288 | 2 min per 10 | 100 | 2016-09-04 | 2016-09-23 |
| PASCAL_020 | CHI | Complete | 2016-09-06 | 33.14 | −118.99 | 2016-09-29 | 33.73 | −120.95 | ST4300 | 288 | 2 min per 10 | 100 | 2016-09-07 | 2016-09-29 |
| PASCAL_021 | MOB | Complete | 2016-09-04 | 35.29 | −122.24 | 2016-09-25 | 36.00 | −122.56 | ST4300 | 288 | 2 min per 10 | 100 | 2016-09-03 | 2016-09-25 |
| PASCAL_022 | SND | Complete | 2016-09-05 | 33.06 | −120.99 | 2016-09-28 | 34.24 | −120.95 | ST4300 | 288 | 2 min per 10 | 100 | 2016-09-05 | 2016-09-28 |
| PASCAL_023 | SND | Complete | 2016-09-24 | 33.00 | −121.00 | 2016-09-28 | 33.11 | −120.92 | ST4300 | 288 | 2 min per 2 | 100 | 2016-09-24 | 2016-09-28 |
| PASCAL_024 | SND | Complete | 2016-09-24 | 33.08 | −120.98 | 2016-09-28 | 33.14 | −120.81 | ST300 | 288 | 2 min per 2 | 100 | 2016-09-24 | 2016-09-28 |
| PASCAL_024 | SND | Complete | 2016-09-24 | 33.08 | −120.98 | 2016-09-28 | 33.14 | −120.81 | ST4300 | 288 | 2 min per 2 | 100 | 2016-09-24 | 2016-09-28 |
| PASCAL_025 | SND | Complete | 2016-09-24 | 33.14 | −121.06 | 2016-09-28 | 33.18 | −120.75 | ST4300 | 288 | 2 min per 2 | 100 | 2016-09-24 | 2016-09-28 |
| PASCAL_026 | CHI | Complete | 2016-09-24 | 34.35 | −121.08 | 2016-09-26 | 34.09 | −120.84 | ST300 | 288 | 2 min per 2 | 250 | 2016-09-24 | 2016-09-26 |
| PASCAL_026 | CHI | Complete | 2016-09-24 | 34.35 | −121.08 | 2016-09-26 | 34.09 | −120.84 | ST4300 | 288 | 2 min per 2 | 100 | 2016-09-24 | 2016-09-26 |
| PASCAL_027 | CHI | Complete | 2016-09-24 | 34.06 | −121.05 | 2016-09-26 | 34.10 | −120.86 | ST4300 | 288 | 2 min per 2 | 100 | 2016-09-24 | 2016-09-26 |
| PASCAL_028 | CHI | Complete | 2016-09-24 | 33.97 | −120.99 | 2016-09-29 | 33.86 | −121.26 | ST4300 | 288 | 2 min per 2 | 100 | 2016-09-24 | 2016-09-29 |
| PASCAL_029 | CHI | Complete | 2016-09-26 | 34.05 | −121.05 | 2016-09-28 | 33.97 | −120.87 | ST4300 | 288 | 2 min per 2 | 100 | 2016-09-26 | 2016-09-28 |
| PASCAL_029 | CHI | Complete | 2016-09-26 | 34.05 | −121.05 | 2016-09-28 | 33.97 | −120.87 | ST300 | 288 | 2 min per 2 | 250 | 2016-09-26 | 2016-09-28 |
| PASCAL_030 | CHI | Complete | 2016-09-26 | 34.04 | −121.08 | 2016-09-28 | 34.02 | −120.86 | ST4300 | 288 | 2 min per 2 | 100 | 2016-09-26 | 2016-09-28 |
PASCAL Data
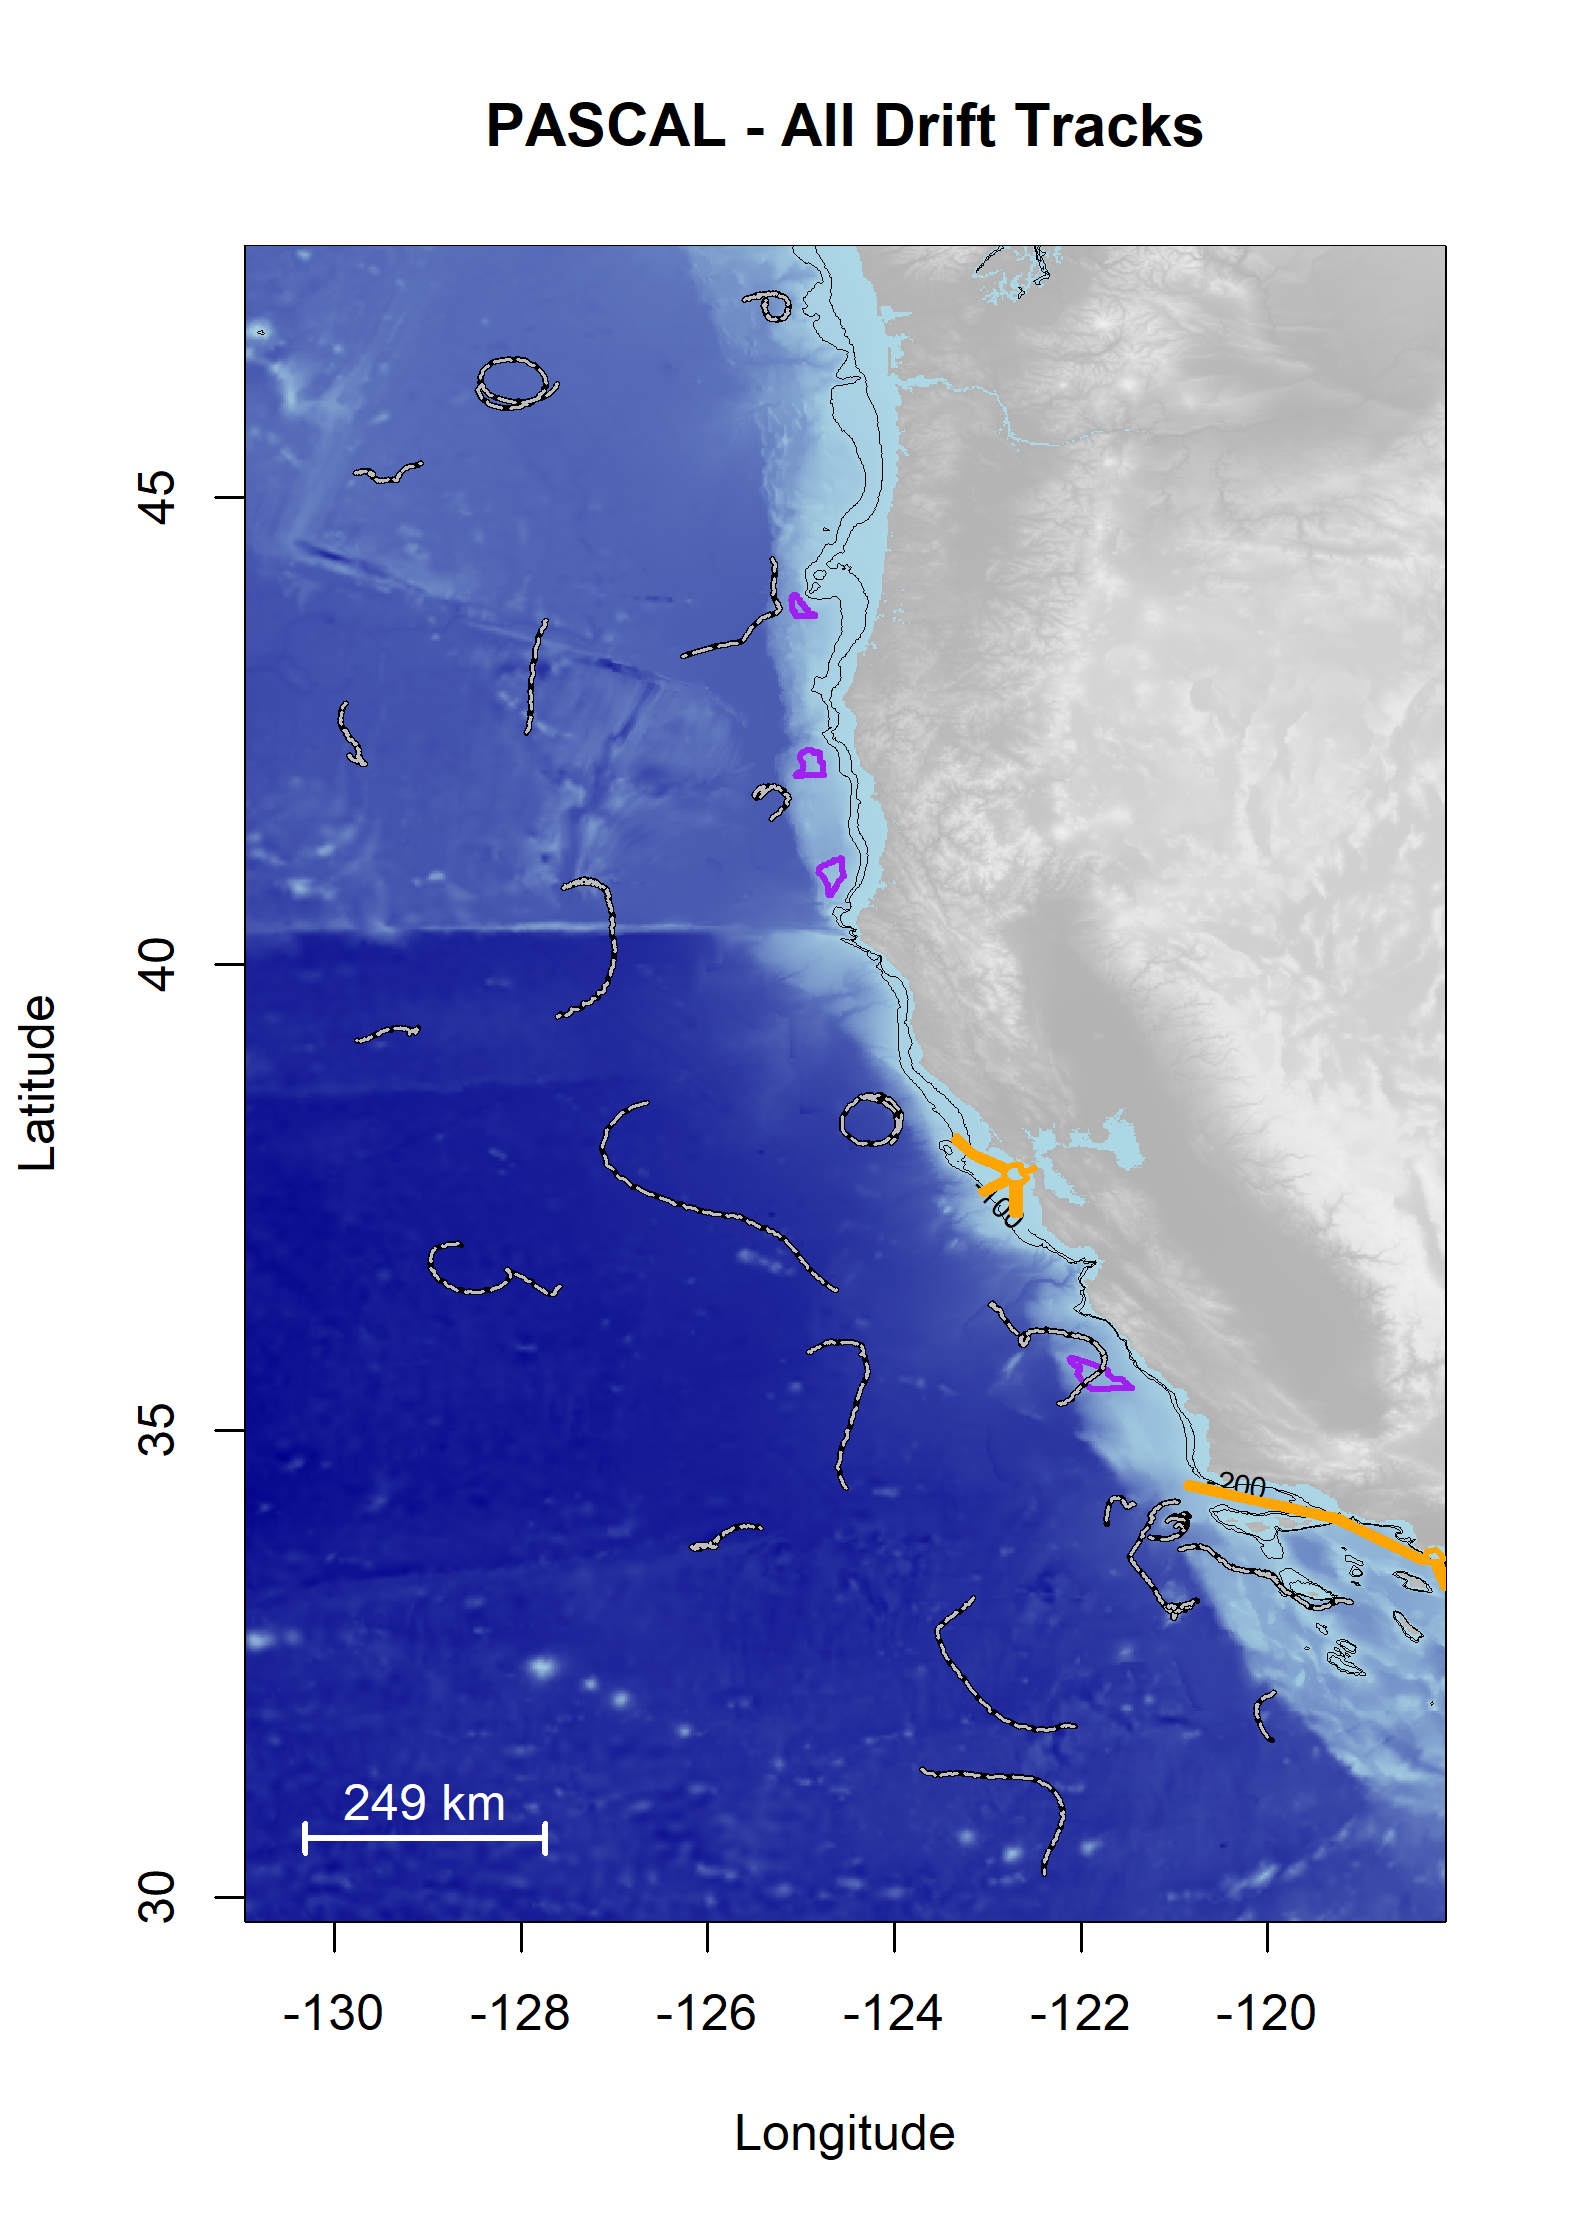
PASCAL was a dedicated cetacean acoustic survey in the California Current off the U.S. West Coast in August and September 2016. Background information on this survey as well as preliminary analysis are provided in (Keating et al. 2018). A map of drift tracks is provided in Figure 1.
Deployment Map
Data were analyzed following methods consistent with the Adrift data analysis, with slight modifications to address duty cycled data. The power spectral density plots (PSD) can be found online.
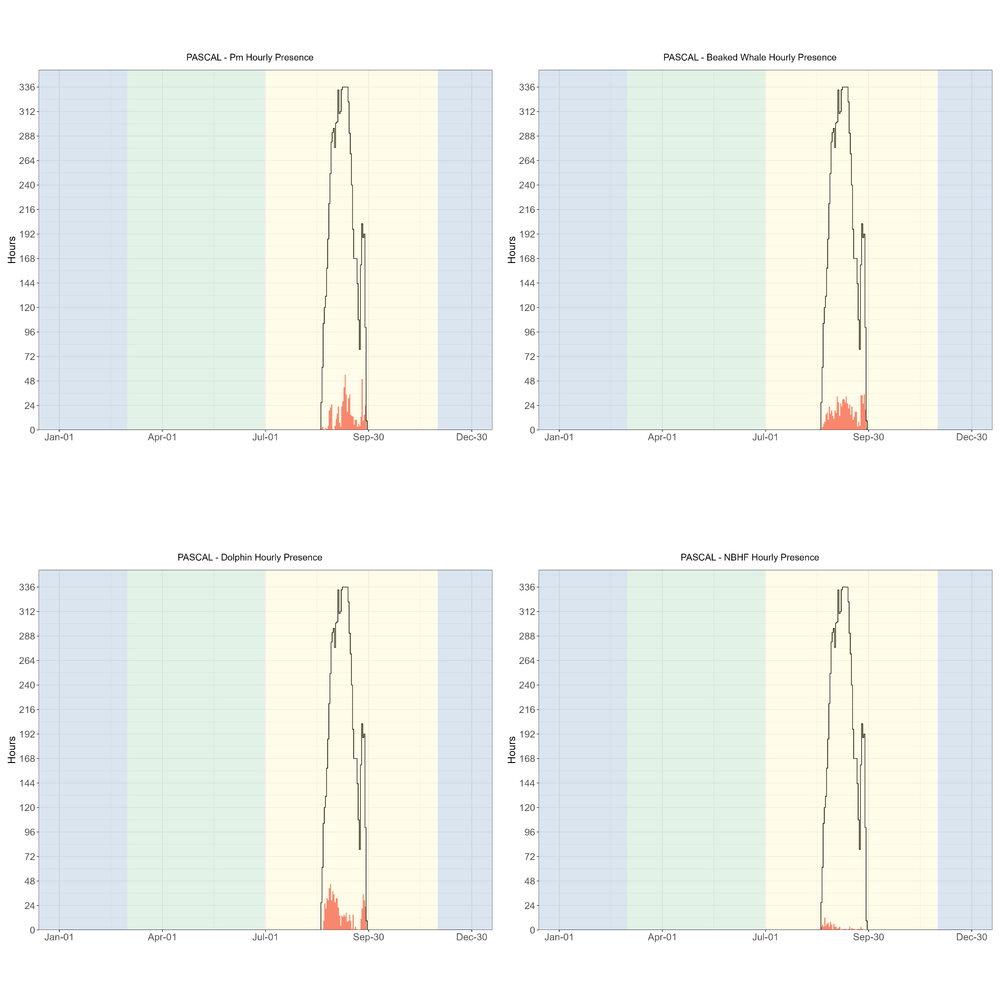
Odontocete Detections
Each of the major odontocete groups were detected during the PASCAL study (Figure 2).
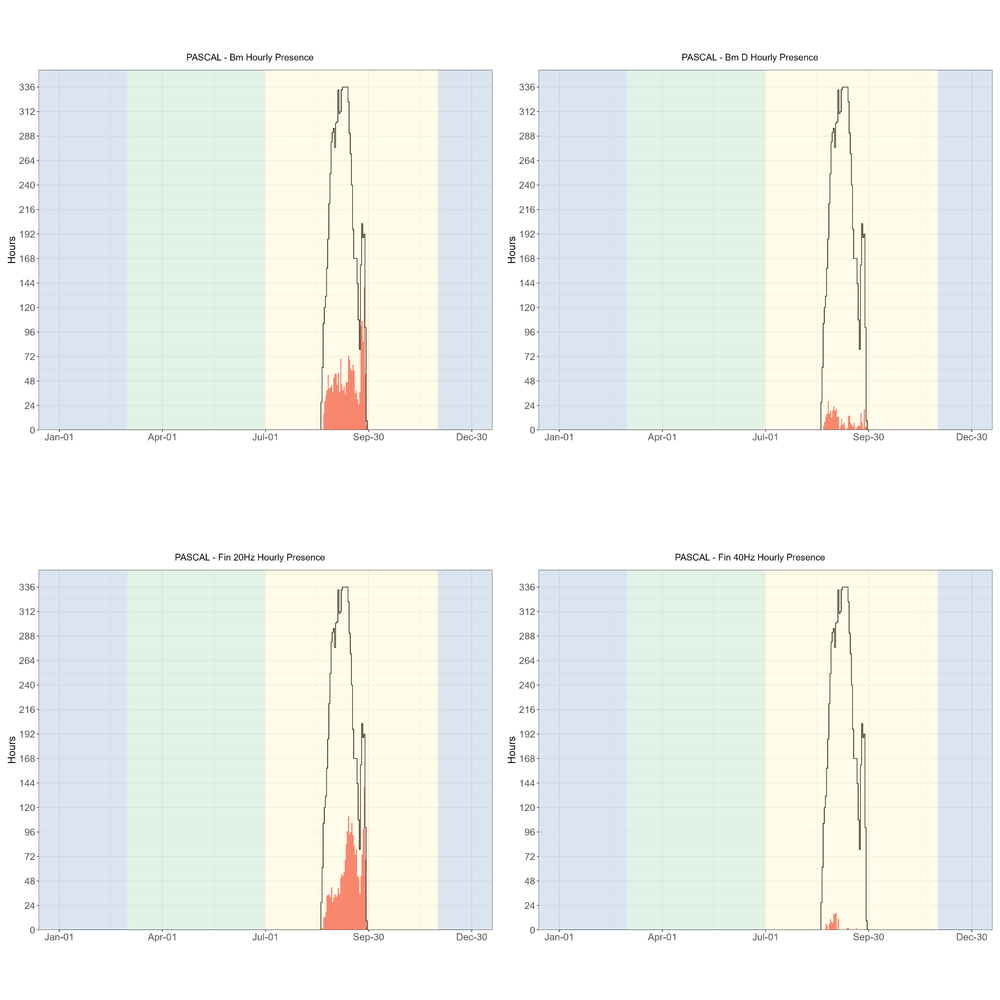
Mysticete Detections
Blue whale detections were dominated by song, as the low hourly presence of D calls indicates that A/B (song) calls dominated the blue whale detections (Figure 3). Likewise, detection of fin whales was dominated by 20 Hz calls (Figure 3). There were no calls associated with Bryde’s or Gray whales.
There were few hourly detections of humpback whales (hourly presence plots can be found in our GitHub Repository. Most of the PASCAL deployments were further offshore than the Adrift deployments, and this offshore distribution may be the reason for such low detection rates.
There were a few calls associated with sei and minke whales. There is little known about the vocal repertoire of sei whales in the Pacific Ocean, although a single encounter with four loud low-frequency downsweeps were detected and considered as ‘possible’ sei whale vocalizations (see spectrogram in our GitHub Repository. Minke whale boings are seasonal vocalizations and more frequently detected during the winter.
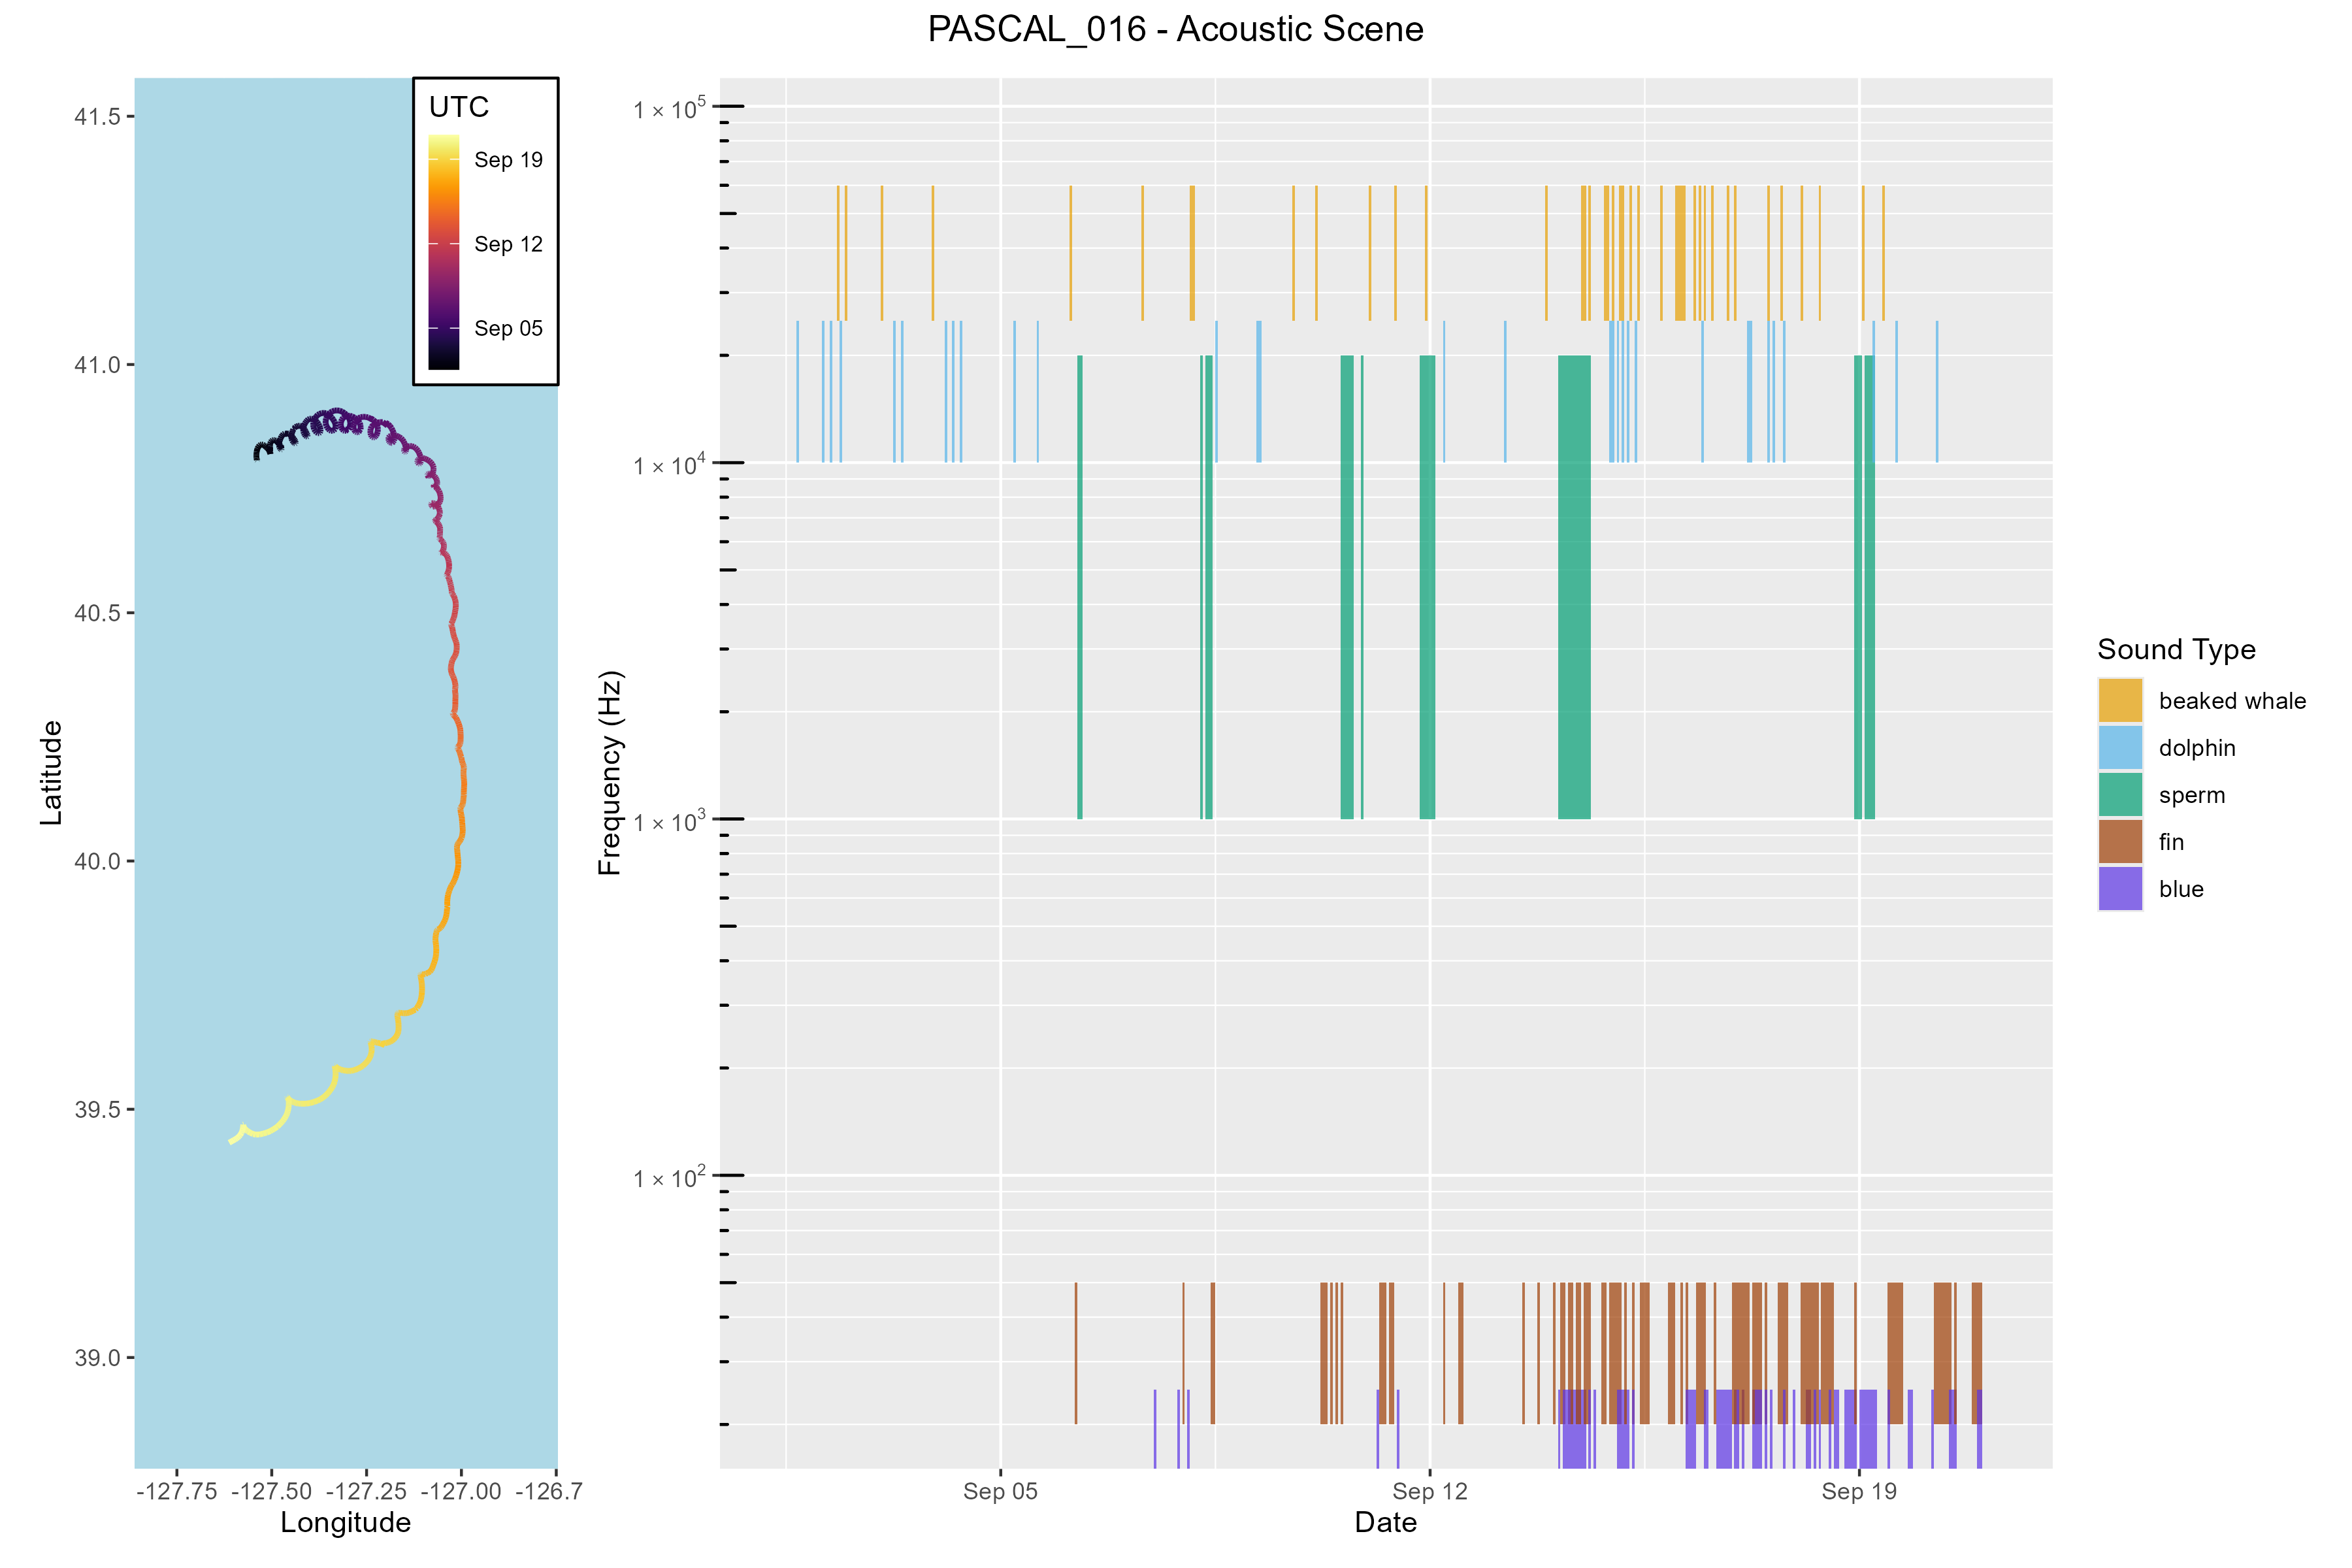
Acoustic Scenes by Drift
Temporal variation (marked in hourly bins) in the contribution of these sounds to the overall soundscape are provided by the acoustic scene. An acoustic scene provides a visualization of the spectral variation in the contributors to the soundscape, where detection of various species classes is noted by the approximate frequency of their sounds (see Figure 4). Acoustic Scenes were created for each CCES drift, and high resolution images are saved in the Adrift Github Repository, and links to specific drifts are provided in the table, below.
| PASCAL_001 | PASCAL_016 |
| PASCAL_002 | PASCAL_017 |
| PASCAL_003 | PASCAL_018 |
| PASCAL_004 | PASCAL_019 |
| PASCAL_005 | PASCAL_020 |
| PASCAL_006 | PASCAL_021 |
| PASCAL_007 | PASCAL_022 |
| PASCAL_008 | PASCAL_023 |
| PASCAL_009 | PASCAL_024 |
| PASCAL_010 | PASCAL_025 |
| PASCAL_011 | PASCAL_026 |
| PASCAL_012 | PASCAL_027 |
| PASCAL_013 | PASCAL_028 |
| PASCAL_014 | PASCAL_029 |
| PASCAL_015 | PASCAL_030 |
PASCAL Deployment Table
A complete list of successful drifting acoustic recorder deployments during the PASCAL survey are provided in table (below). Sites include Washington (WAS), Columbia River (COL), Oregon (ORE), Humboldt (HUM), Mendocino (MND), Point Arena (PTA), Monterey Bay (MBY), Morro Bay (MOB), Channel Islands (CHI), San Diego (SND), and Baja California Norte (BCN). See Study Area Figure 1 for more information on regions.
References
Keating, Jennifer, Jay Barlow, Emily T. Griffiths, and Jeffrey E. Moore. 2018. “Passive Acoustics Survey of Cetacean Abundance Levels (PASCAL-2016) Final Report.” https://www.boem.gov/sites/default/files/environmental-stewardship/Environmental-Studies/Pacific-Region/Studies/BOEM-2018-025.pdf.