Fin Whales

Fin whales were detected throughout the study area and at different times of year (Figure 1). Detection of fin whales during the combined PASCAL/CCES surveys showed strong presence in the Morro Bay and San Francisco regions, with low detections in Humboldt and Oregon (Figure 1).

Fin whale 20 Hz pulses had higher detection probabilities in the post-upwelling seasons for all locations (see table, right, and (fin-ADRIFT_fin2040_HourlyPresence?). This detection probability dropped during the (limited) winter data for Humboldt.

Upwelling Post-Upwelling Winter
20 Hz
Oregon 0.08 (1430)  0.37 (493)   – (–)
Humboldt 0.06 (489)   0.31 (1048)  0.09 (308) 
San Francisco 0.04 (960)   0.12 (688)   – (–)
Morro Bay 0.15 (2034)  0.54 (1353)  – (–)
40 Hz
Oregon 0.04 (1430)  0.20 (493)   – (–)
Humboldt 0.00 (489)   0.00 (1048)  0.00 (308) 
San Francisco 0.00 (960)   0.00 (688)   – (–)
Morro Bay 0.00 (2034)  0.09 (1353)  – (–)

Fin whale 20 Hz detections were lower off San Francisco than other areas, though detection of low frequency fin whale calls in this area may be compromised by low frequency noise associated with high levels of low frequency noise associated with large shipping traffic (container ships).

The fin whale 20 Hz call is the most commonly reported and is thought to be used as a social call to establish and maintain contact when produced in irregular sequences (Edds-Walton 1997) and it may serve a reproductive function when produced by males in a regular sequence forming song (Croll et al. 2002). Here we did not differentiate between irregular and regular sequencing.
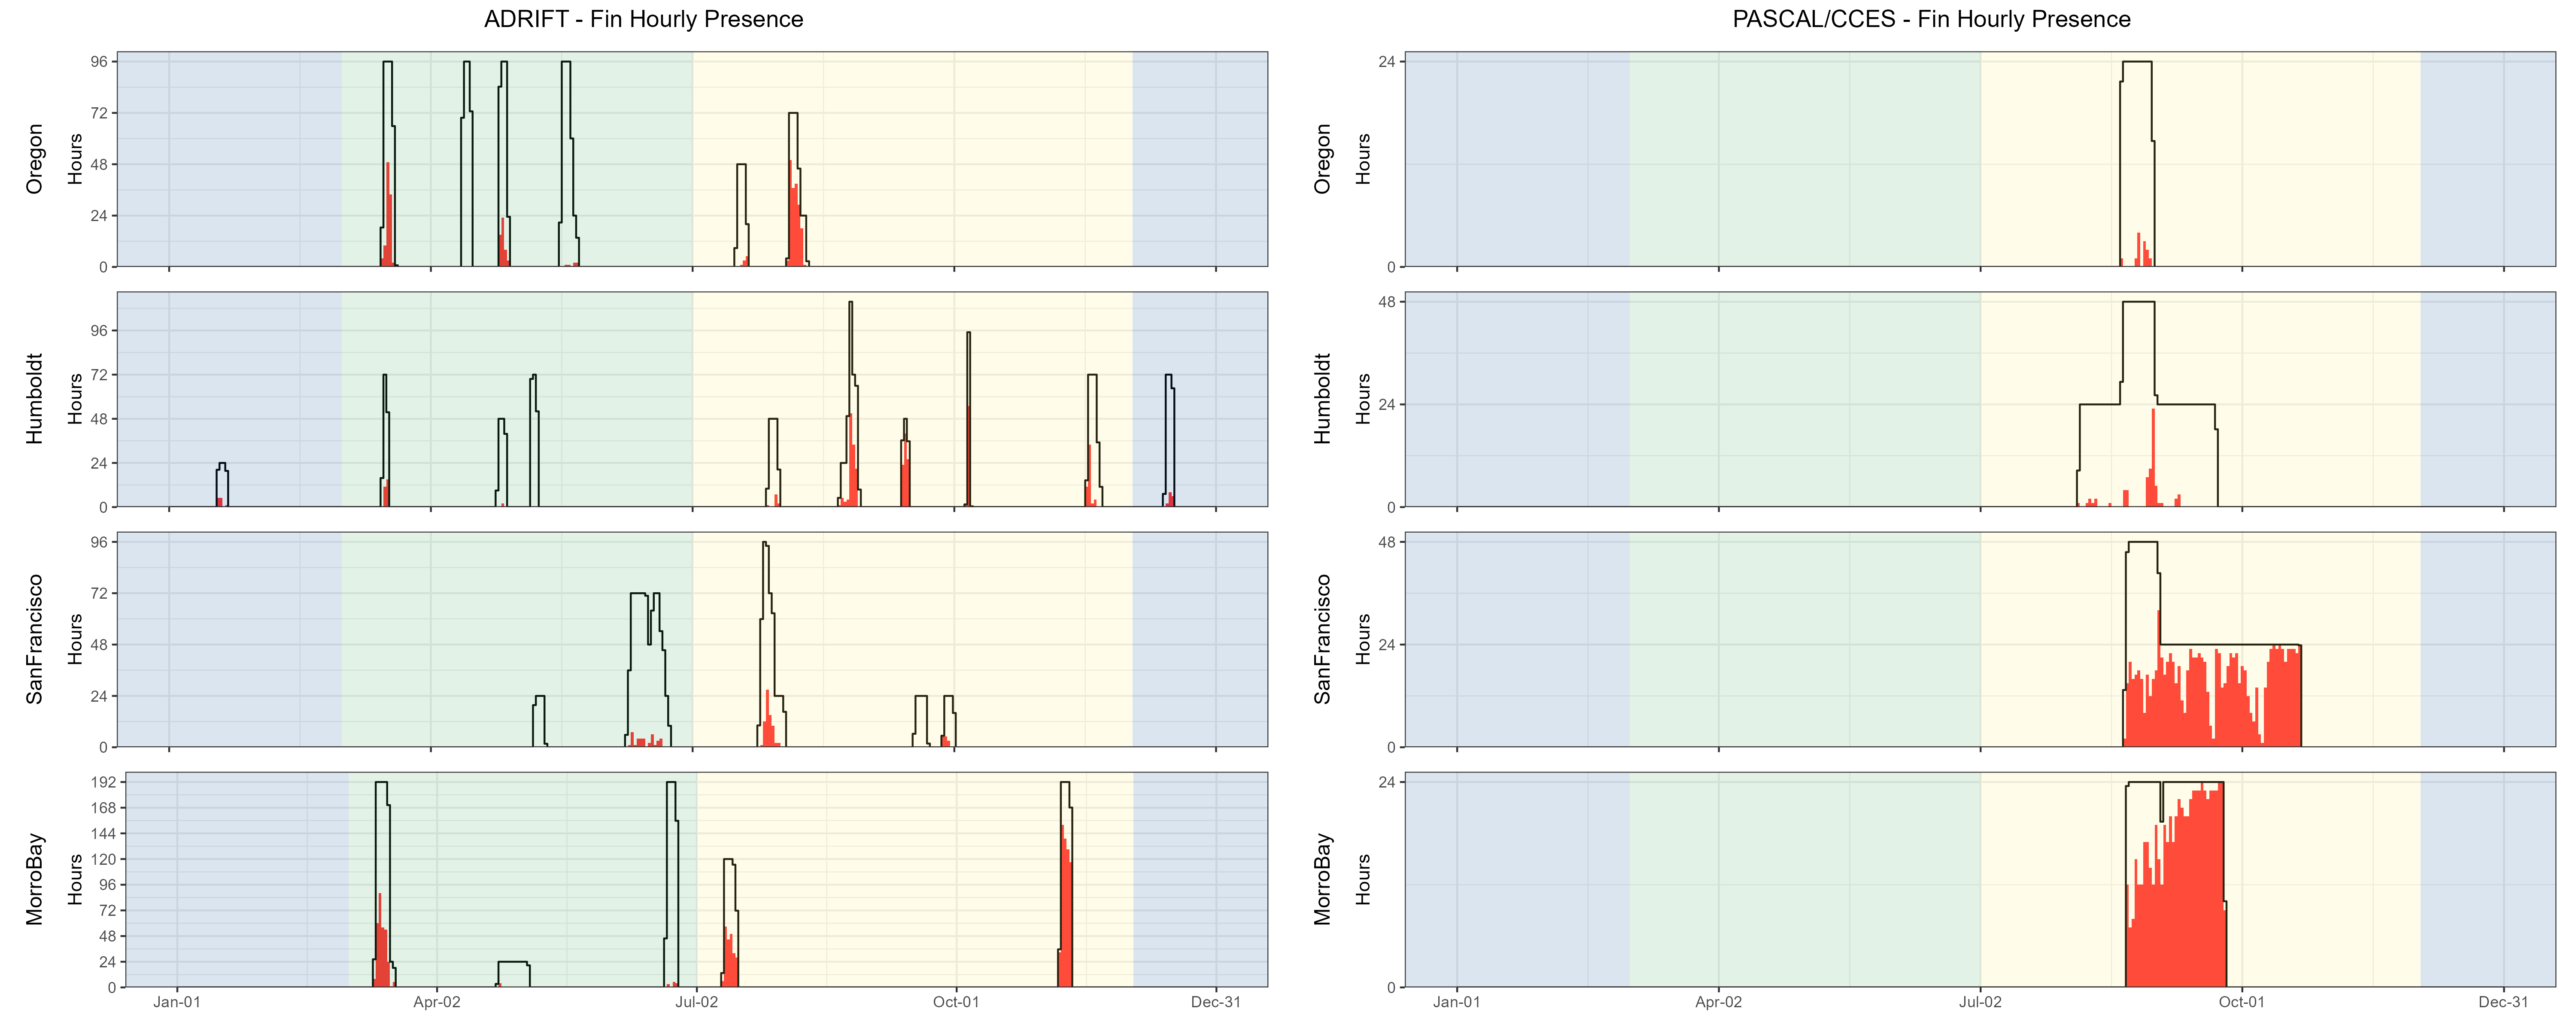
Hourly presence of fin whales detected during the Adrift study (left graph) and the combined PASCAL/CCES surveys (right graph). Detections in Oregon are shown in the top graphs, then Humboldt, San Francisco, and Morro Bay at the bottom. The number of hours is provided on the y-axis, and the date on the x-axis, with seasons shaded in blue for winter, green for upwelling, and yellow for the post-upwelling season. Effort is outlined with a black line, and hours of effort with detections are highlighted in red. Detection of fin whales varied by drift for the Adrift survey. Detections of fin whales were very strong in San Francisco and Morro Bay for PASCAL/CCES surveys, with few detections in Oregon and Humboldt.

Figure 1: Hourly fin whale events by month, region for Adrift and combined PASCAL, CCES surveys. Hourly presence of fin whales (combined call types) (y axis) for different months for combined years (x axis) and for each region (Oregon, Humboldt, San Francisco, and Morro Bay) for ADRIFT (left) and combined Pascal and CCES (right). Hourly presence for duty-cycled data relates to the portion of the hour included in the duty cycled data. Black lines represent total available hours (effort) and red lines represent hours with detections. Blue shading represents winter, green represents upwelling, and yellow represents the post-upwelling oceanographic season.

The 40 Hz call has a more irregular pattern and has been positively associated with prey biomass, providing evidence that it is associated with a foraging function (Romagosa et al. 2021). Most 40 Hz fin whale detections occurred off Oregon, with a few detections off Morro Bay. Detection probability was highest during the post-upwelling season for both Oregon and Morro Bay (there were no detections during the upwelling season off Morro Bay).
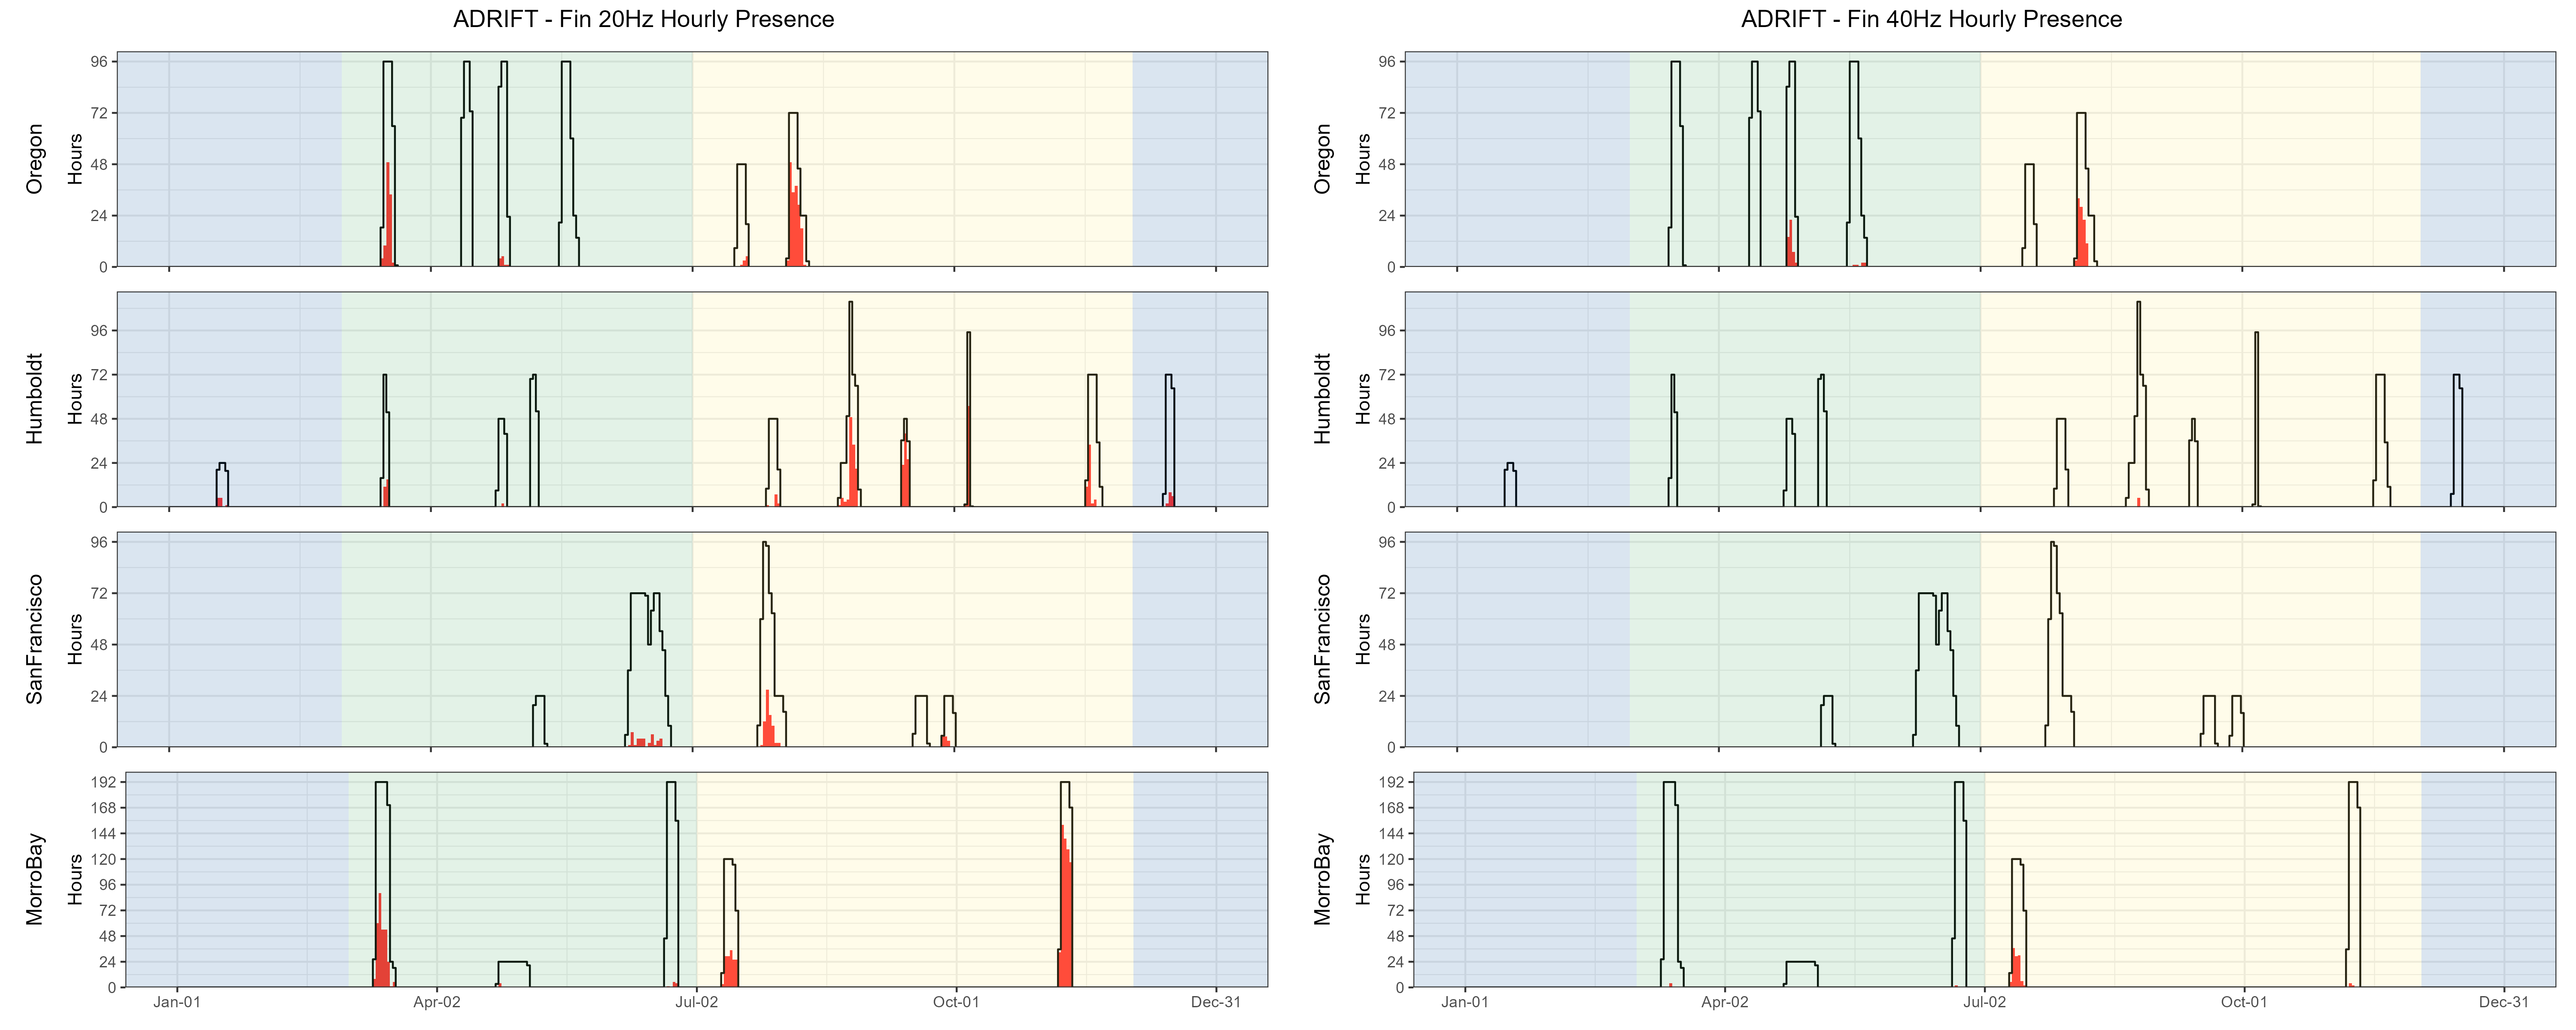
Hourly presence of fin whale 20 Hz calls detected during the Adrift study (left graph) and fin whale 40 Hz calls (right graph). Detections in Oregon are shown in the top graphs, then Humboldt, San Francisco, and Morro Bay at the bottom. The number of hours is provided on the y-axis, and the date on the x-axis, with seasons shaded in blue for winter, green for upwelling, and yellow for the post-upwelling season. Effort is outlined with a black line, and hours of effort with detections are highlighted in red. Most fin whale calls detected were 20 Hz calls; detection of fin whale 40 Hz calls were primarily from Oregon and Morro Bay.

Figure 5.9. Hourly presence of fin whale 20, 40 Hz calls by month, region for Adrift. Hourly presence of fin 20 Hz calls (left) and fin 40 Hz calls (right) (y axis) for different months for combined years (x axis) and for each region (Oregon, Humboldt, San Francisco, and Morro Bay). Adrifts 001-012 were duty cycled and hourly presence relates to the portion of the hour included in the duty cycled data (6 min of 12 min). Black lines represent total available hours (effort) and red lines represent hours with detections. Blue shading represents winter, green represents upwelling, and yellow represents the post-upwelling oceanographic season.

Detailed methods are provided in our GitHub online analysis methods , in a report provided by OSA and archived on our Adrift Analysis Methods.

A pilot study to develop a deep learning network to detect and classify fin whale 20 and 40 Hz calls was initiated by Ocean Science Analytics (see Fin Whale AI and OSA Report on Fin Whale Deep Learning in Github Repository.

References

Croll, Donald A., Christopher W. Clark, Alejandro Acevedo, Bernie Tershy, Sergio Flores, Jason Gedamke, and Jorge Urban. 2002. “Only Male Fin Whales Sing Loud Songs.” Nature 417 (6891): 809–9. https://doi.org/10.1038/417809a.
Edds-Walton, PEGGY L. 1997. “Acoustic Communication Signals of Mysticete Whales.” Bioacoustics 8 (1-2): 4760. https://doi.org/10.1080/09524622.1997.9753353.
Romagosa, Miriam, Sergi Pérez-Jorge, Irma Cascão, Helena Mouriño, Patrick Lehodey, Andreia Pereira, Tiago A. Marques, Luís Matias, and Mónica A. Silva. 2021. “Food Talk: 40-Hz Fin Whale Calls Are Associated with Prey Biomass.” Proceedings of the Royal Society B: Biological Sciences 288 (1954): 20211156. https://doi.org/10.1098/rspb.2021.1156.