| Upwelling | Post-Upwelling | Winter | |
|---|---|---|---|
| A | |||
| Oregon | 0.00 (1430) | 0.00 (493) | – (–) |
| Humboldt | 0.00 (489) | 0.50 (1048) | 0.01 (308) |
| San Francisco | 0.00 (960) | 0.31 (688) | – (–) |
| Morro Bay | 0.00 (2034) | 0.31 (1353) | – (–) |
| B | |||
| Oregon | 0.00 (1430) | 0.00 (493) | – (–) |
| Humboldt | 0.00 (489) | 0.74 (1048) | 0.07 (308) |
| San Francisco | 0.02 (960) | 0.50 (688) | – (–) |
| Morro Bay | 0.00 (2034) | 0.63 (1353) | – (–) |
| D | |||
| Oregon | 0.00 (1430) | 0.00 (493) | – (–) |
| Humboldt | 0.00 (489) | 0.07 (1048) | 0.00 (308) |
| San Francisco | 0.03 (960) | 0.06 (688) | – (–) |
| Morro Bay | 0.00 (2034) | 0.09 (1353) | – (–) |
Blue Whales
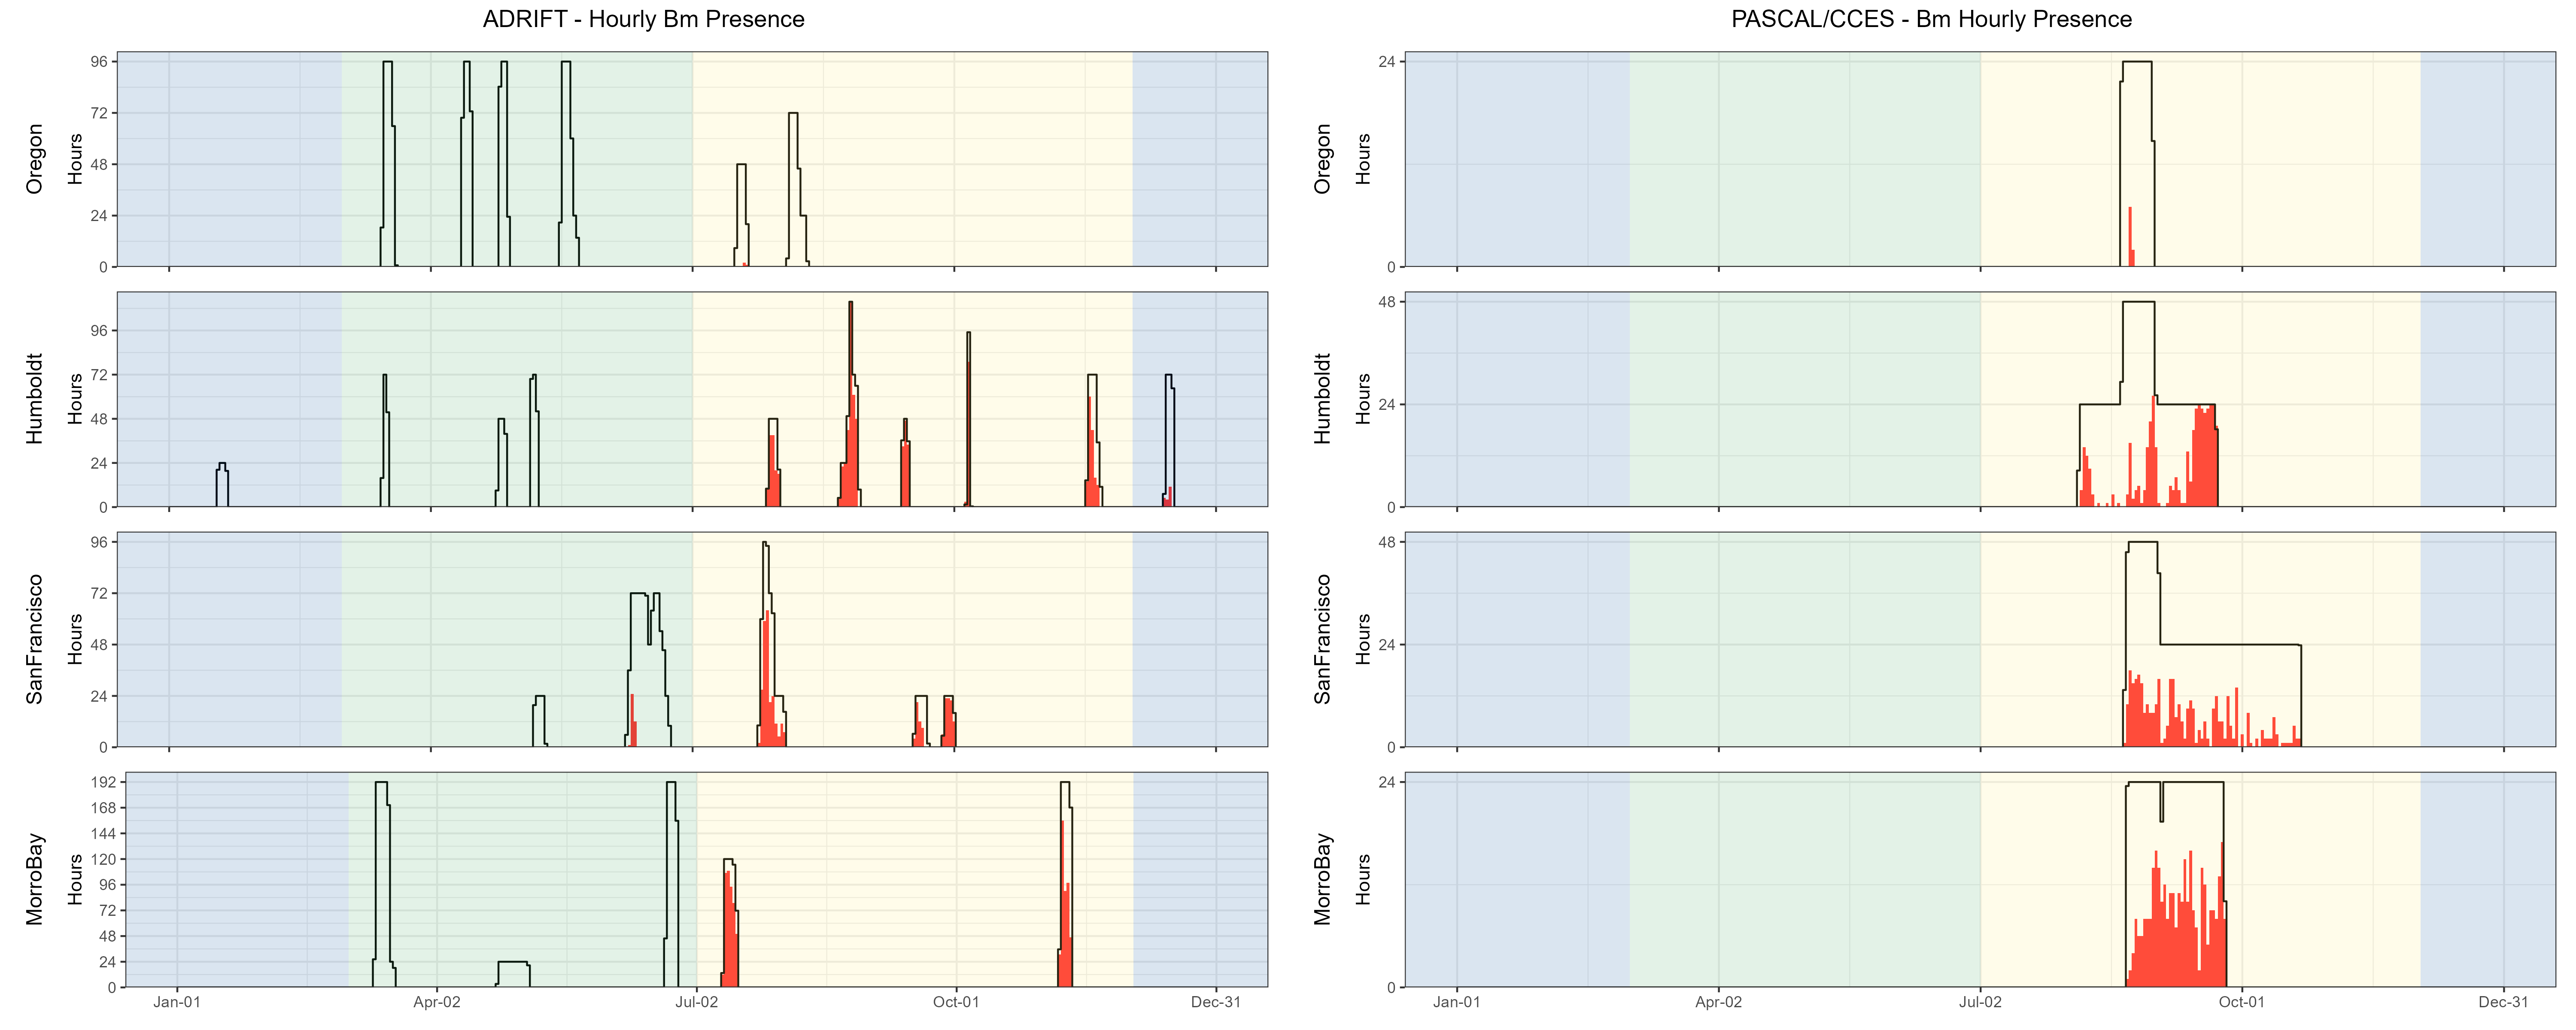
Blue whales were detected in all regions except Oregon (Figure 1), with most detections during the post-upwelling season (see table, right). Similar to the overall Adrift project, blue whales were detected in all regions during the combined PASCAL/CCES surveys, with low detections of blue whales off Oregon (Figure 1).
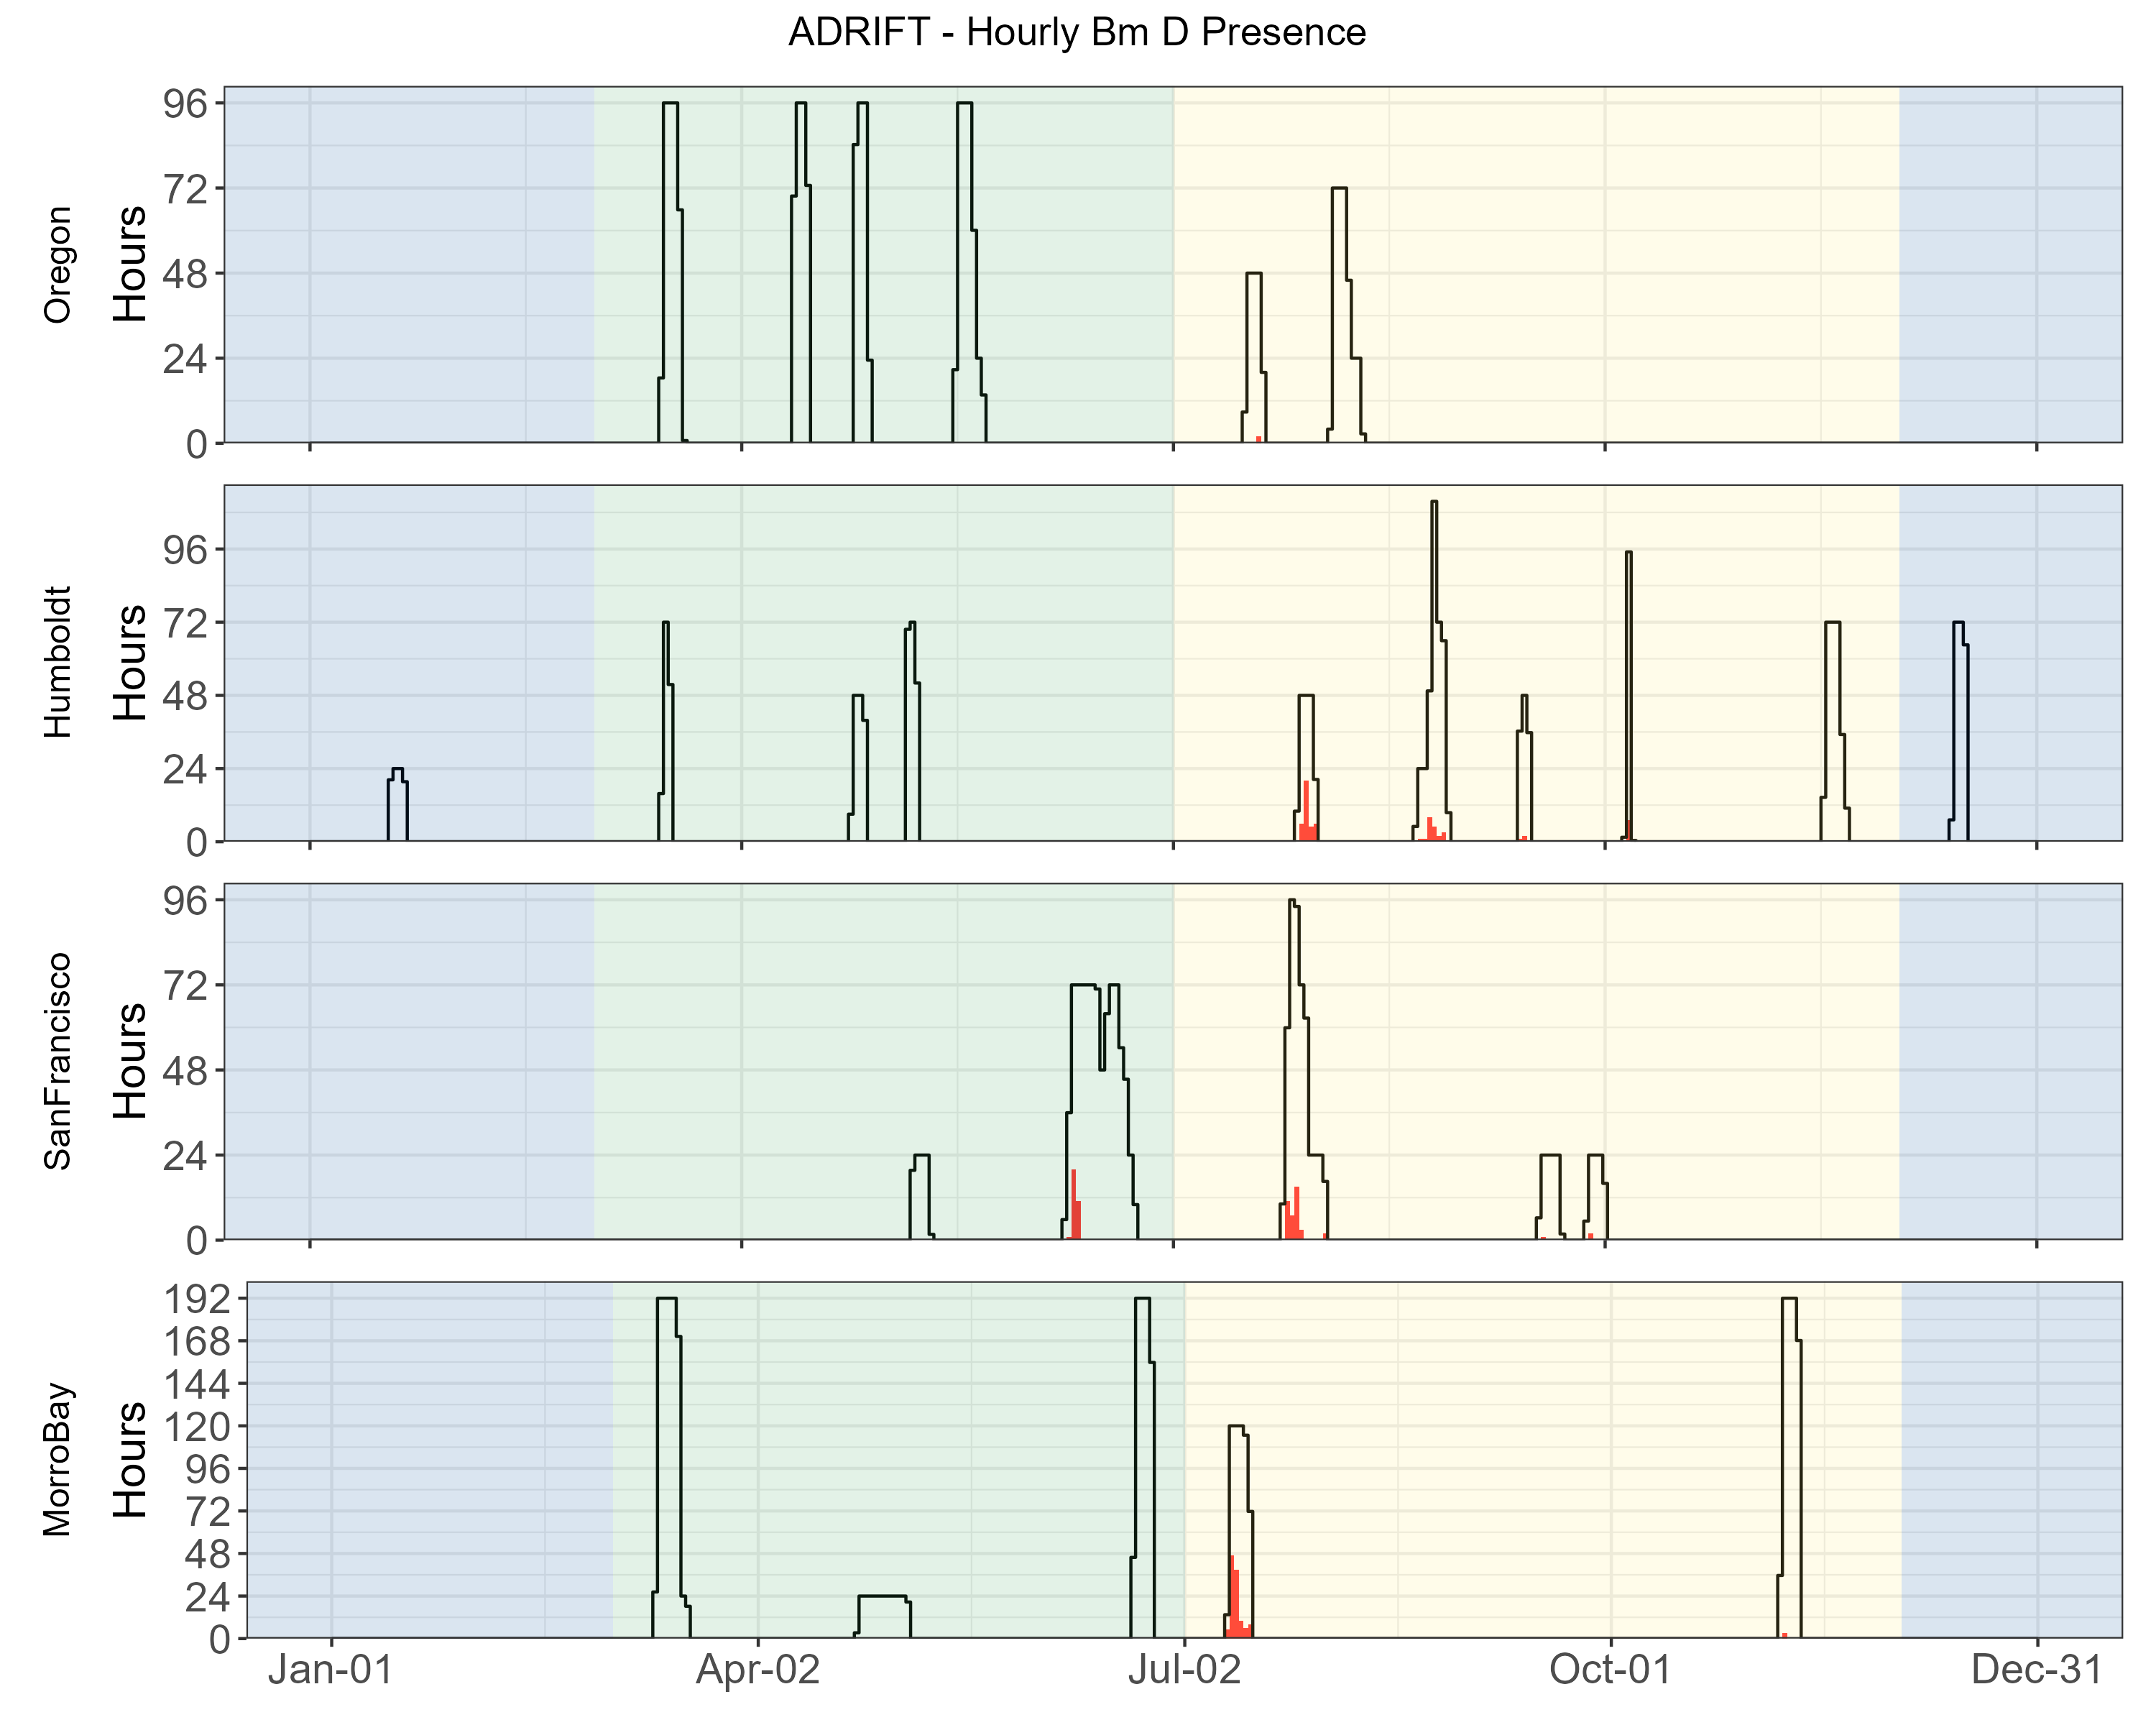
Detection of blue whale calls were primarily A and B calls associated with song, with few detections of D calls during the summer months (Figure 2).
Blue whale ‘song’ consists of both A and B calls, which can occur individually or in A-B pairs. Detection of both A and B calls were higher during the post-upwelling seasons in all areas (see table, right). The hourly probability of detecting blue whale A and B calls during the limited data off Humboldt in the winter were higher than during the upwelling season, but lower than the post-upwelling season.
There were only a few blue whale B calls detected during the upwelling season off San Francisco; no other calls associated with song were detected during the upwelling season in any region. The probability of detecting blue whale B calls was consistently higher than A calls for all regions (and seasons), which reflects research showing that blue whale B calls can be detected at greater ranges than blue whale A calls (McDonald et al. 2001). Blue whale B calls can be readily classified by an experienced analyst when the SNR (signal to noise ratio) is low.
Blue whale D calls have been associated with feeding behavior (Oleson, Wiggins, and Hildebrand 2007), and detection of D calls were primarily during the post-upwelling season (Figure 2). The probability of detecting D calls was much lower than detecting A and/or B calls, and there were no detection of D calls off Oregon (see table, above). Low SNR D calls are more readily confused with low frequency downsweep calls produced by other species, reducing the overall effective detection range for these calls.
There were an additional 227 ad hoc detections of blue whales during the OSA analysis of other low-frequency baleen whale species (see OSA Project Report). The majority of those detections were either low SNR calls or were masked by noise while scanning the LTSAs.
Detailed methods are provided in our Adrift Analysis Methods.
References
McDonald, Mark A., John Calambokidis, Arthur M. Teranishi, and John A. Hildebrand. 2001. “The Acoustic Calls of Blue Whales Off California with Gender Data.” The Journal of the Acoustical Society of America 109 (4): 1728–35. https://doi.org/10.1121/1.1353593.
Oleson, Erin M., Sean M. Wiggins, and John A. Hildebrand. 2007. “Temporal Separation of Blue Whale Call Types on a Southern California Feeding Ground.” Animal Behaviour 74 (4): 881–94. https://doi.org/10.1016/j.anbehav.2007.01.022.