Soundscape
The purpose of soundscape monitoring was to describe the ambient noise level(s) and to identify the major contributors to the soundscape. To that end, we measured soundscape metrics and identified two primary sources of noise: self-noise and ship noise. Weather (wind, rain) is a significant contributor to soundscape and varies by season/region. Although we did not quantify this in our analysis, we recommend that future research include weather as a contributor to the soundscape. These data were combined with the detection of biological sounds from marine mammals to examine the biological and anthropogenic contributors to the soundscape.
The SanctSound methods were initially adopted to provide data consistent with previously analyzed data. Soundscape methods have changed significantly in the last three years, and the most recent recommendation is to report sound levels in hybrid millidecade bands. While there is now open-source software that can produce these metrics, it was not available for our analysis. All of our data is publicly available and the LTSAs were retained so that the data can be converted in the future. We recommend that data be reanalyzed to report sound levels in hybrid millidecade bands to align with current standards.
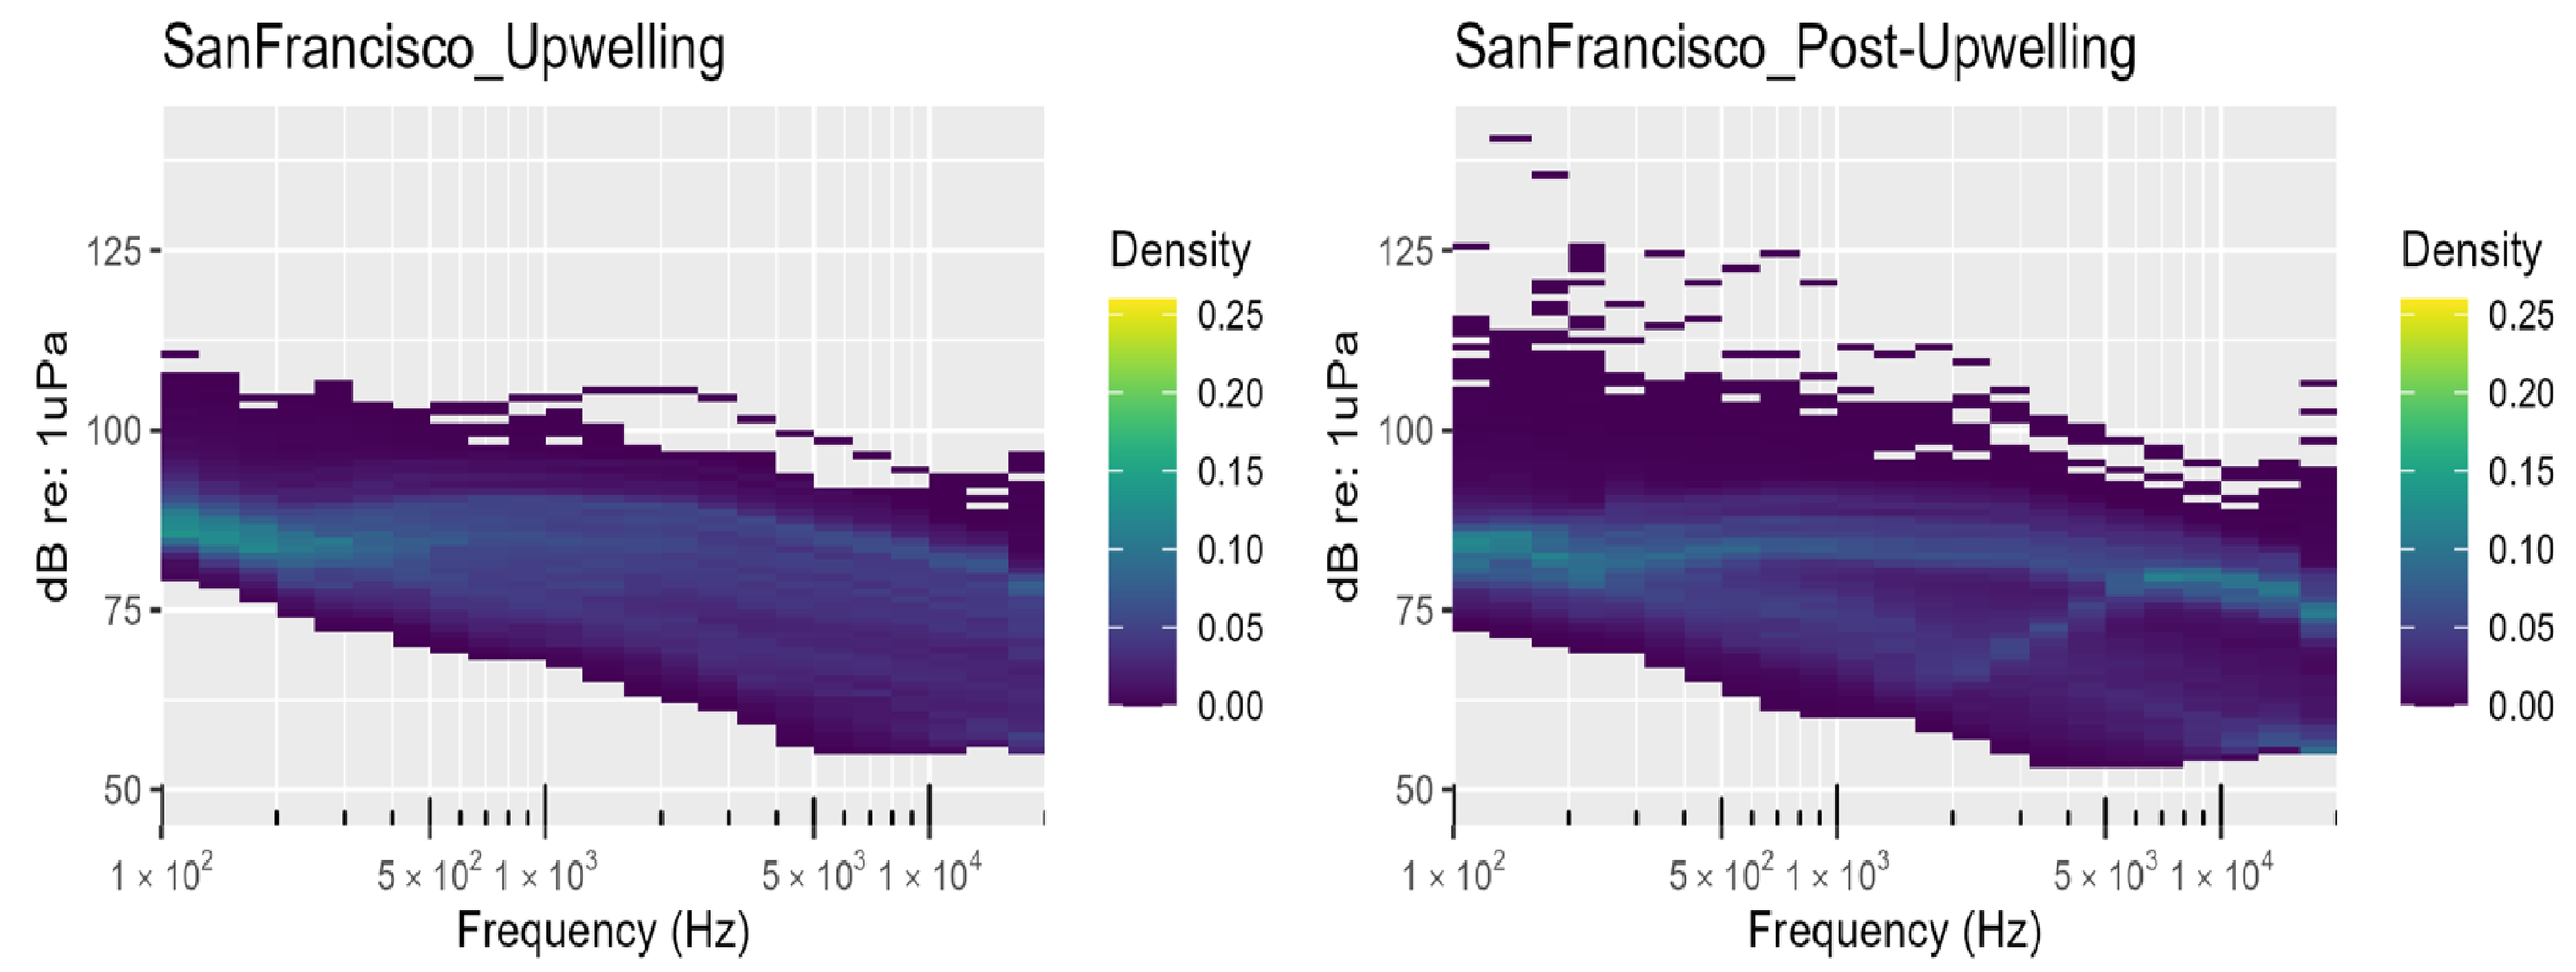
Power Spectral Density The Power Spectral Density (PSD) is the measure of the signal’s power as a function of frequency, and the PSD plots provide a visualization of the ambient noise for each region and season Figure 1. Contributing sounds include biological sounds (marine mammals, fish, invertebrates), environmental noise (wind, rain), and anthropogenic noise (vessel noise, depth sounders, seal bombs). While Figure 1 includes all contributors to the soundscape, seasonal and regional differences can be informative and provide valuable pre-development information regarding the general soundscape. In general, noise levels ranged from 50 dB re 1uPa to nearly 150 dB re 1uPa, with the highest density of sound in the 75 - 100 dB range Figure 1.
Other researchers have developed models to separate the distinct contributions of ship and wind noise to soundscapes ((Erbe et al. 2021); (ZoBell, Hildebrand, and Frasier 2024)). These models have been validated with empirical data and can be in close agreement in certain times and places, but validation has been very limited to small spatiotemporal scales. The data collected in offshore waters of the Adrift-ACCESS survey can be used to validate models which separate wind and shipping contributions to sound levels. This will be an important next step for evaluating changes in the soundscape associated with offshore wind development areas.
Low frequency noise associated with strumming precluded consistent analysis of soundscape below 100Hz. Future drifting recorder studies should consider alternative configurations that eliminate strumming and other self-noise to allow for broadband soundscape analysis.
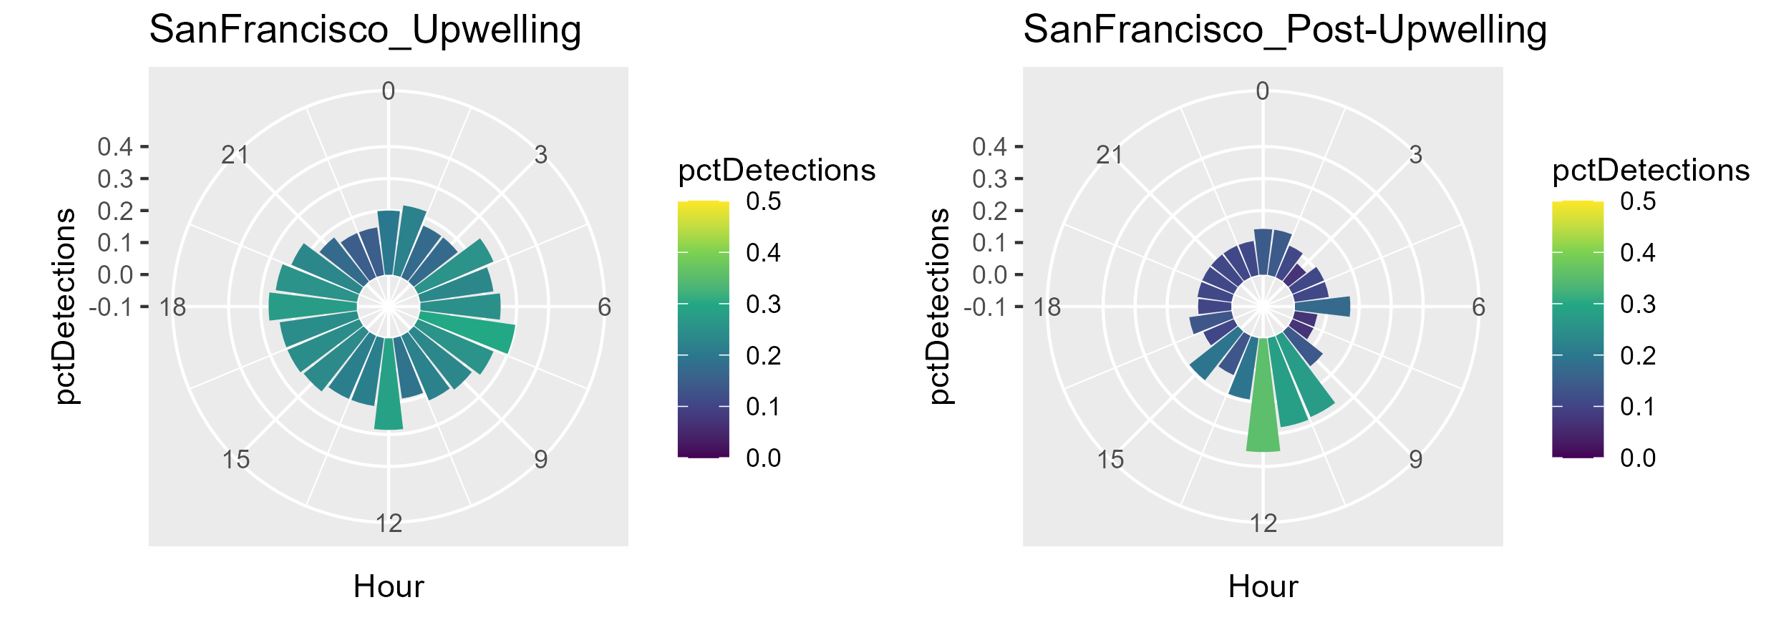
Ship Noise Ships produce different sounds while operating, such as impulsive signals from ship propeller cavitation or echosounder signals that can be easily identified in the LTSA and confirmed with a spectrogram. During the upwelling season, vessel noise was largely consistent throughout the day (with a slight decrease during the night); however, vessel noise was much higher in the late morning in the post-upwelling season Figure 2.
Hourly presence of ships in San Francisco appears to be lower than other regions Figure 2. Our analysis of ship noise considers detection of noise from specific vessels rather than the presence of background ship noise. Analysts noted an overall high level of ambient noise associated with background ship noise Figure 1 and a reduced ability to detect individual vessels. Detection of vessels used manual detection methods (existing automated vessel detectors were not reliable for this dataset); development of a standardized vessel detector that works across datasets could be used to determine if individual ship tracks are difficult to detect in high traffic areas. Future work can include an Automatic Identification System metric such as the number of unique large vessels with relatively close approaches.
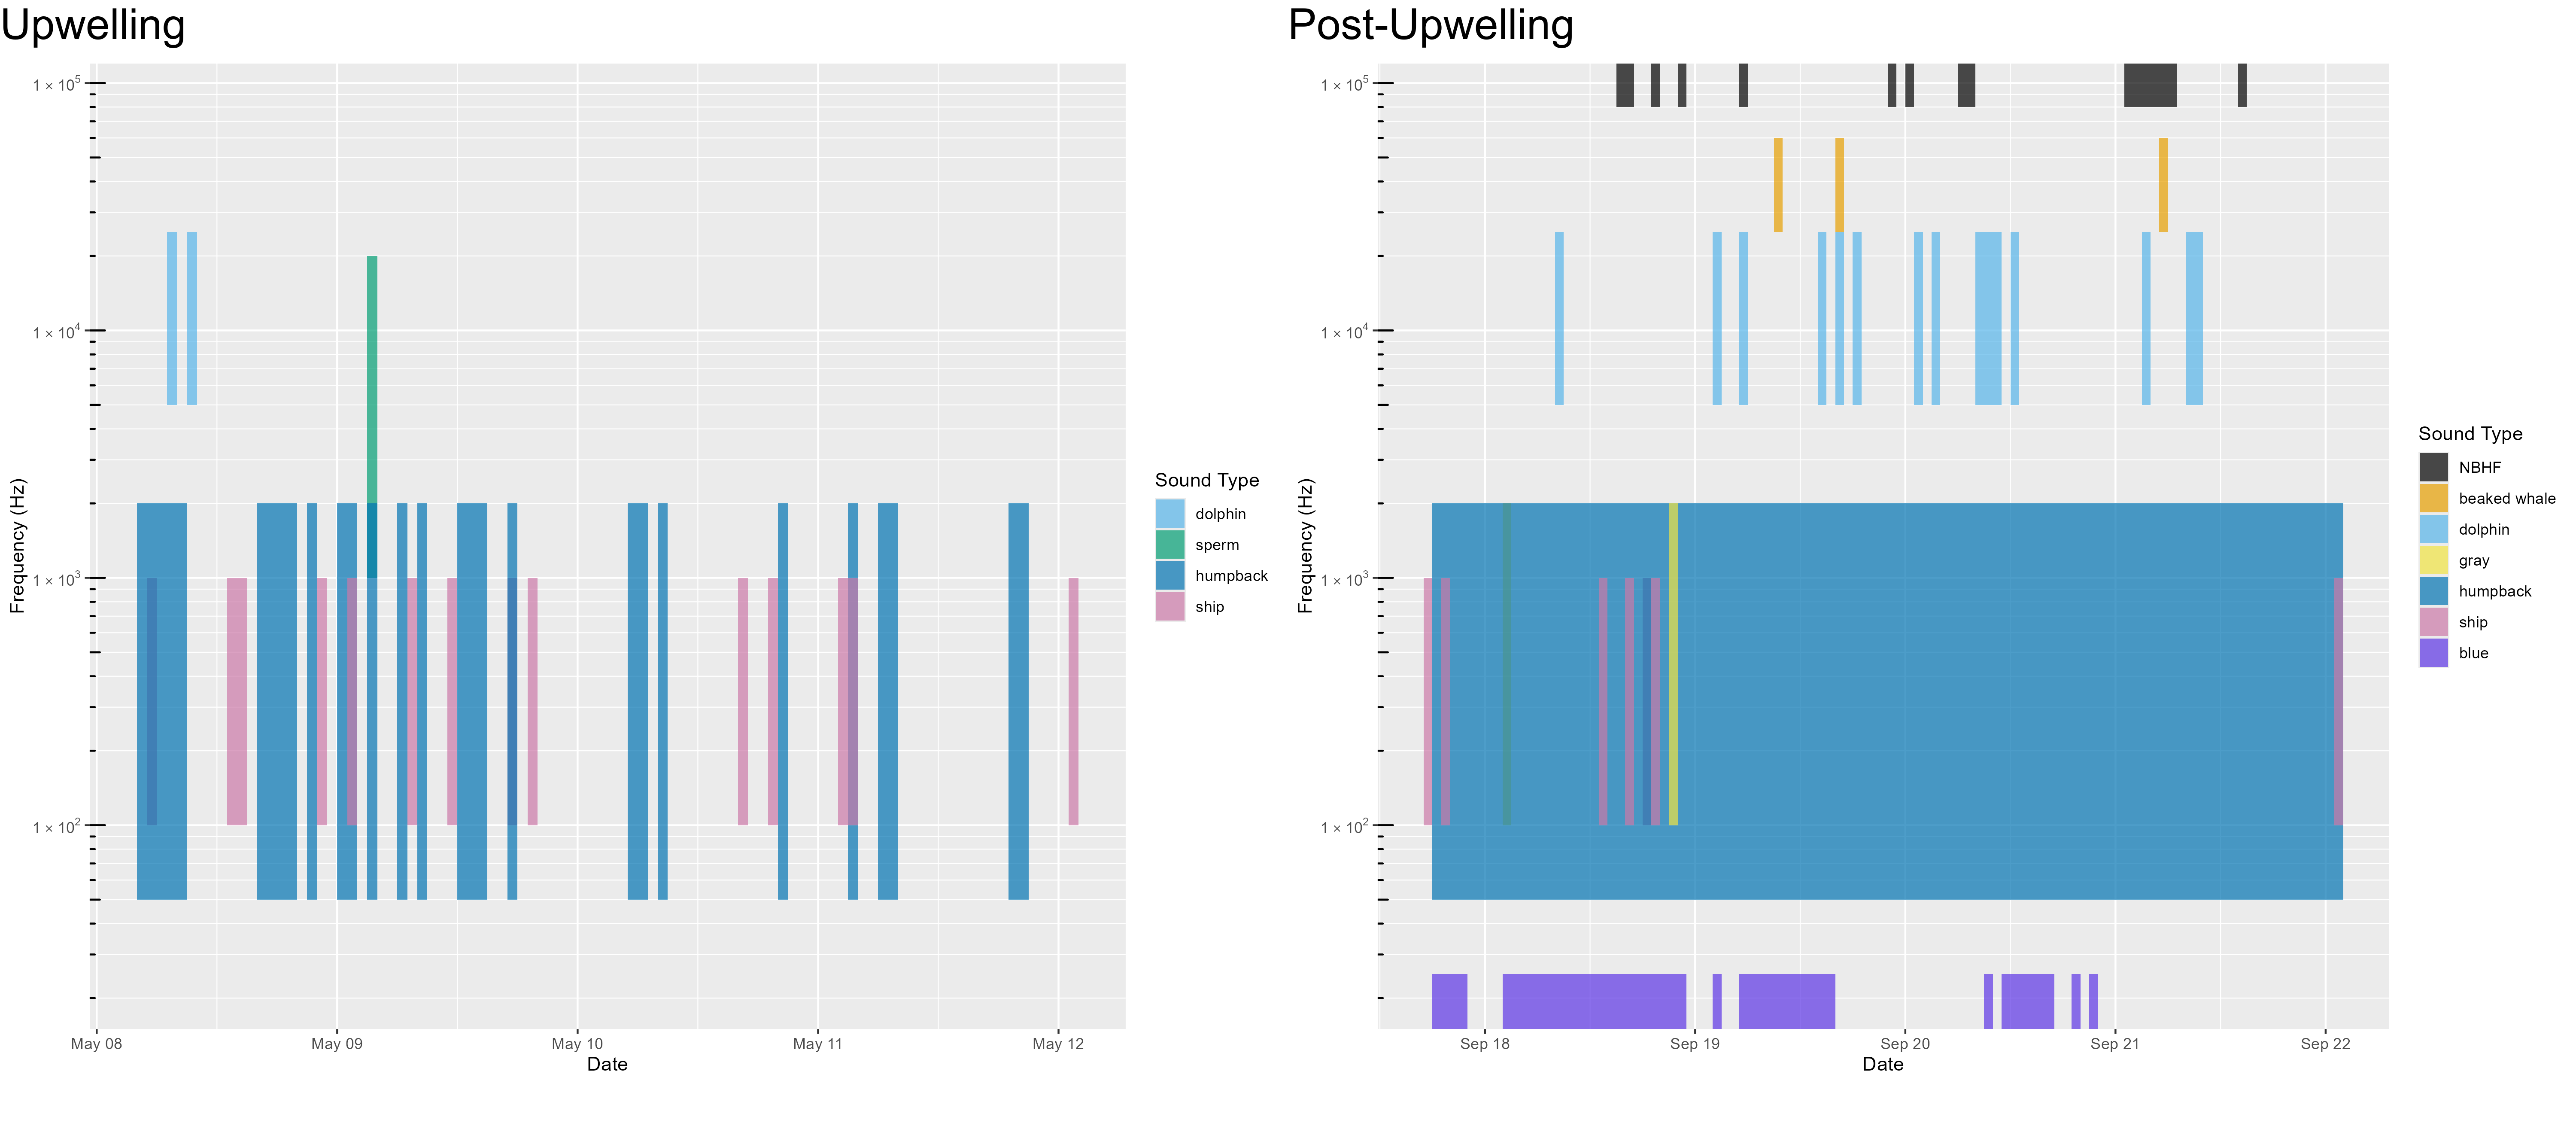
Contributors to the Soundscape The marine soundscape includes sounds associated with physical drivers (rain, waves, earthquakes), biological sources (sounds produced by marine mammals, fish, and invertebrates), as well as anthropogenic sounds. In this study we examined sounds attributed to a number of marine mammal species as well as ship noise. Temporal variation (marked in hourly bins) in the contribution of these sounds to the overall soundscape are provided by the acoustic scene. An acoustic scene provides a visualization of the spectral variation in the contributors to the soundscape, where detection of various species classes is noted by the approximate frequency of their sounds.
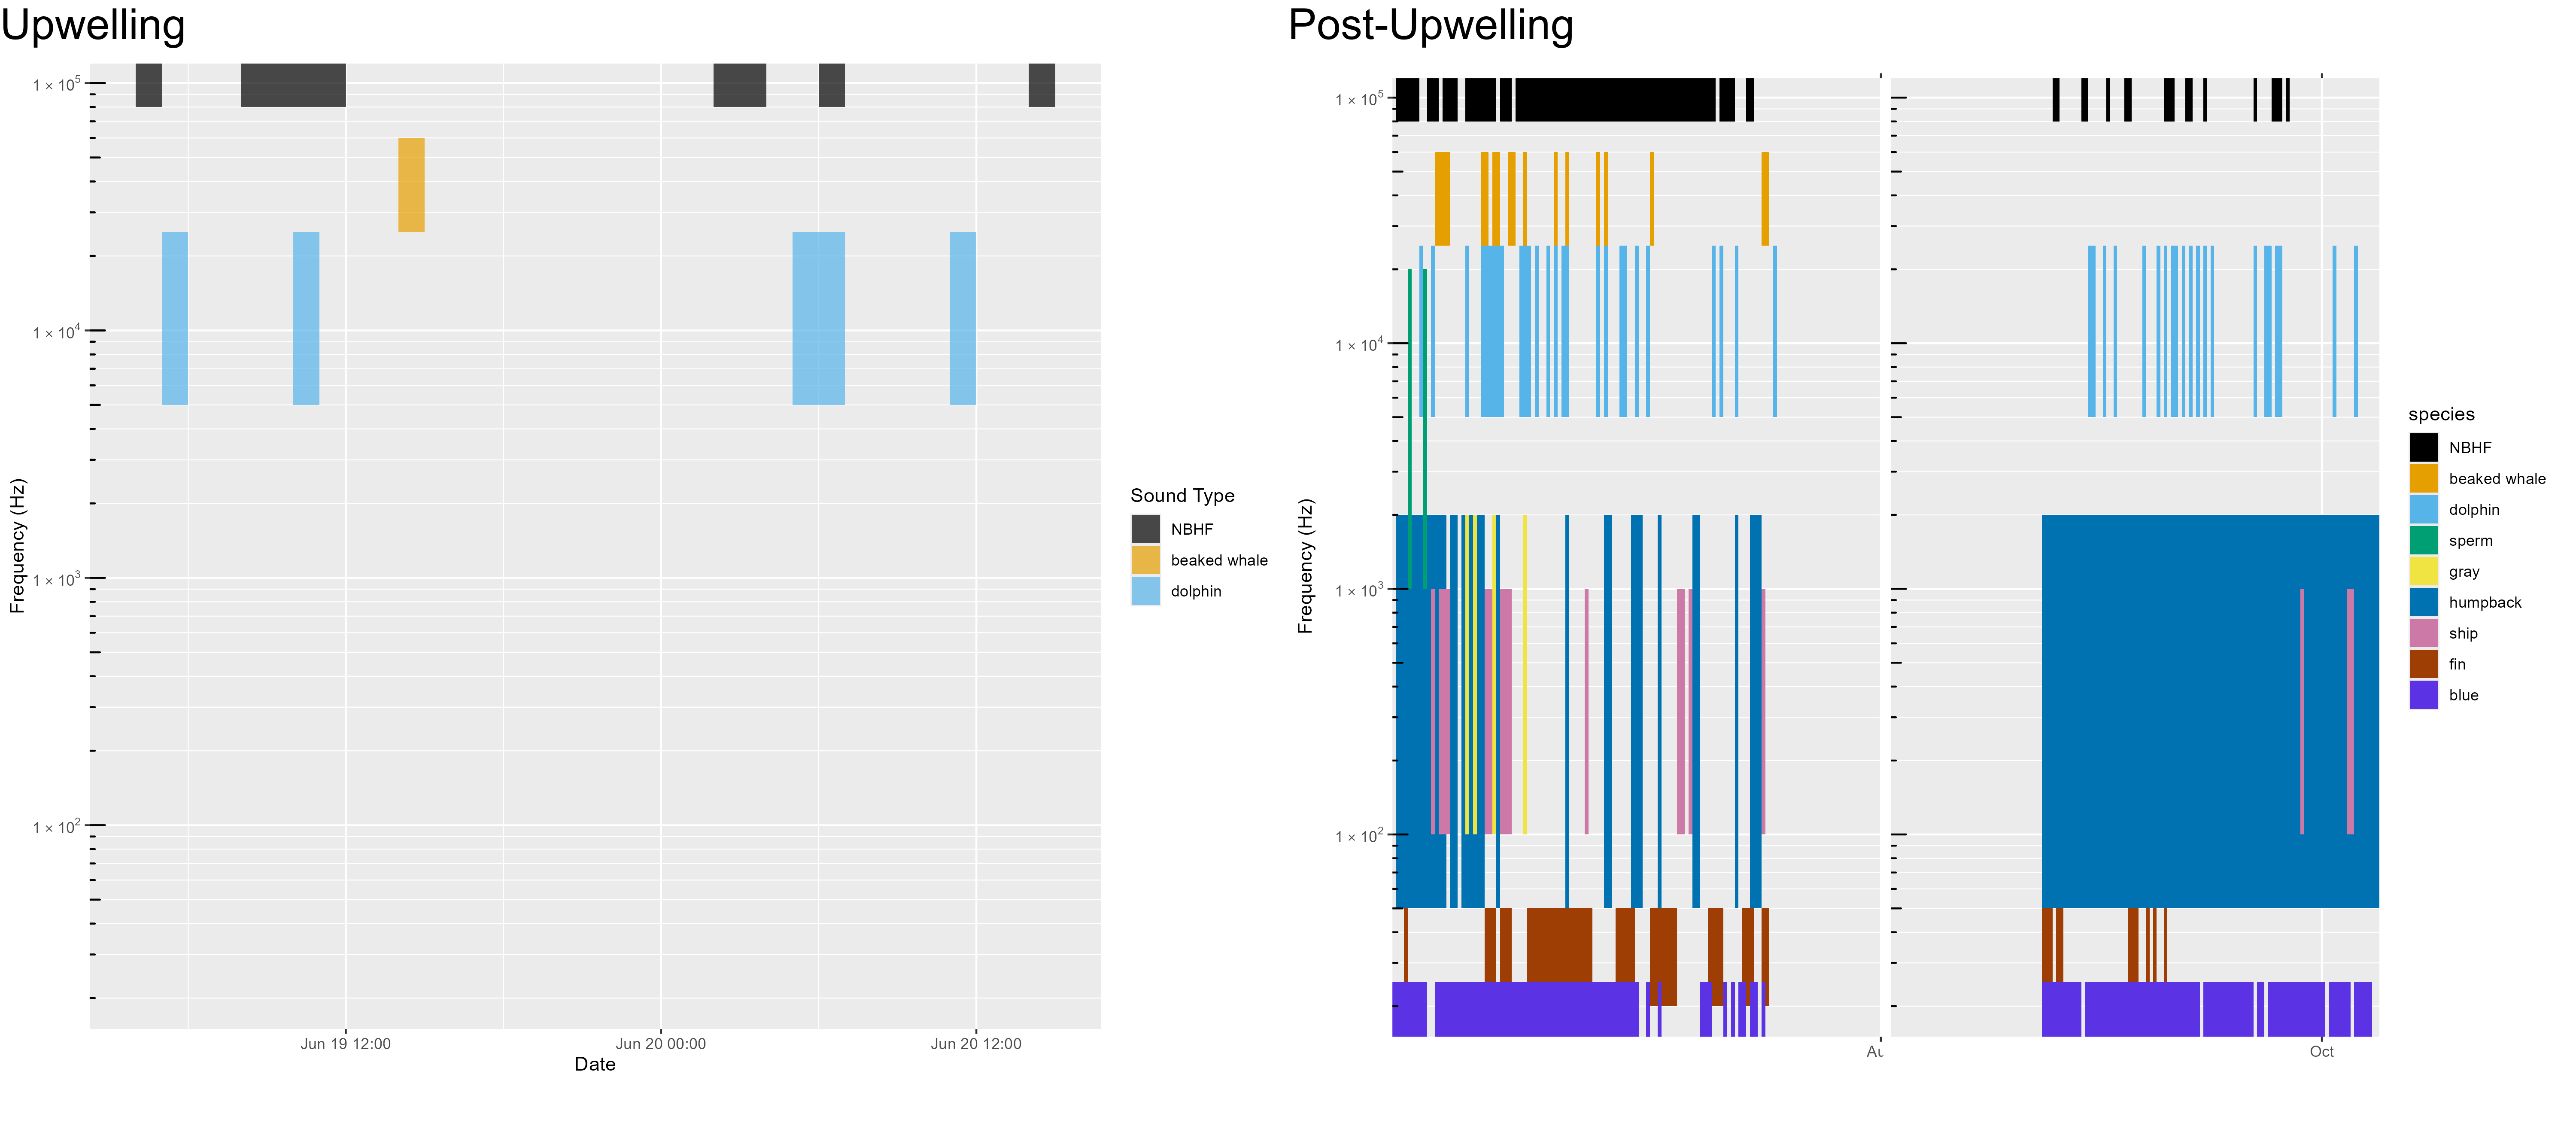
Deployments offshore San Francisco were coordinated with NOAA Sanctuaries’ ACCESS Surveys during the upwelling and post-upwelling oceanographic seasons (Figure 3, Figure 4, Figure 5). Visualizations represent data from 1 or 2 buoys at greater distance from each other (other Adrift buoys were deployed in clusters). Differences in geographic location of deployments in the upwelling and post-upwelling seasons may complicate interpretation of seasonal differences in marine mammal detections.
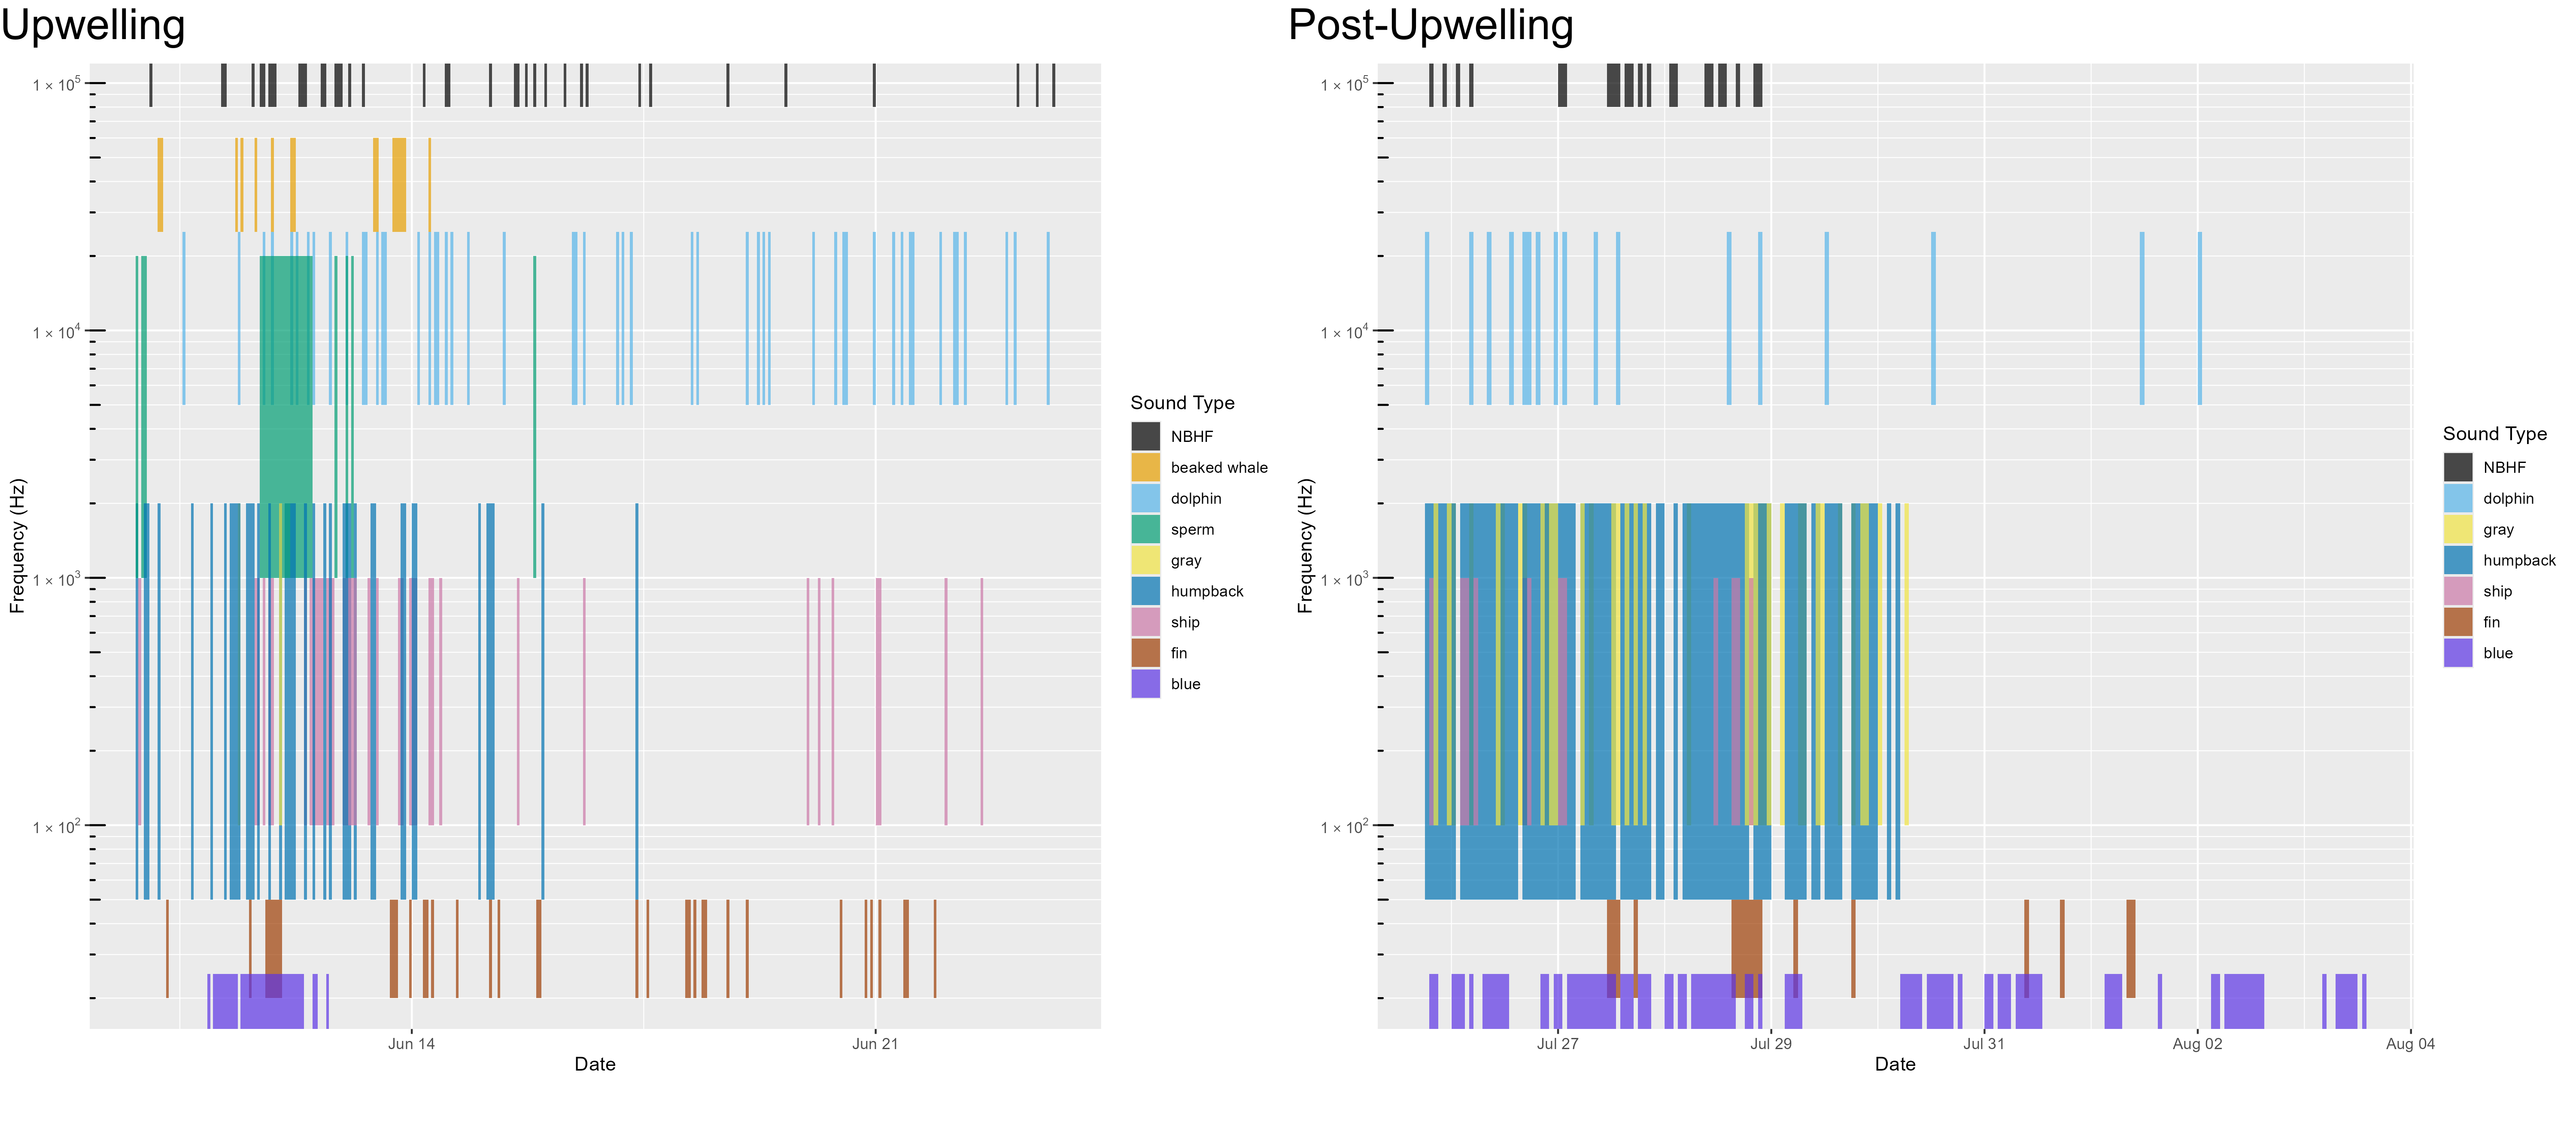
Detection of odontocetes (including NBHF, beaked whales, sperm whales, and dolphins) varied by drift (Figure 3, Figure 4, Figure 5). Detection of baleen whales (humpback, gray, fin, and blue whales) varied by drift, with a general increase in detections of many baleen whale species during the post-upwelling season.
Despite the drift locations being near a convergence of shipping lanes entering San Francisco Bay, detection of specific vessels was relatively modest. Higher ambient noise in this region may have led to decreased detection of individual vessel tracks due to masking.
The marine soundscape includes sounds associated with physical drivers (rain, waves, earthquakes), biological sources (sounds produced by marine mammals, fish, and invertebrates), as well as anthropogenic sounds. During the course of this study we developed automated methods to integrate physical drivers (environmental variables), biological sources (marine mammal detections), as well as anthropogenic sounds to better understand these various contributors to the soundscape, and how they change over time. While we had limited time to conduct advanced analyses, our research efforts took a significant step forward so that future researchers can more readily integrate these methods into their analyses (see online summary of open source software developed as part of this project: Adrift Software).