| Upwelling | Post-Upwelling | Winter | |
|---|---|---|---|
| Regular Clicks | |||
| Oregon | 0.11 (1419) | 0.06 (493) | – (–) |
| Humboldt | 0.25 (452) | 0.37 (935) | 0.35 (264) |
| San Francisco | 0.03 (769) | 0.00 (626) | – (–) |
| Morro Bay | 0.03 (1909) | 0.08 (1245) | – (–) |
| Slow Clicks | |||
| Oregon | 0.00 (1419) | 0.00 (493) | – (–) |
| Humboldt | 0.00 (452) | 0.00 (935) | 0.00 (264) |
| San Francisco | 0.01 (769) | 0.00 (626) | – (–) |
| Morro Bay | 0.00 (1909) | 0.00 (1245) | – (–) |
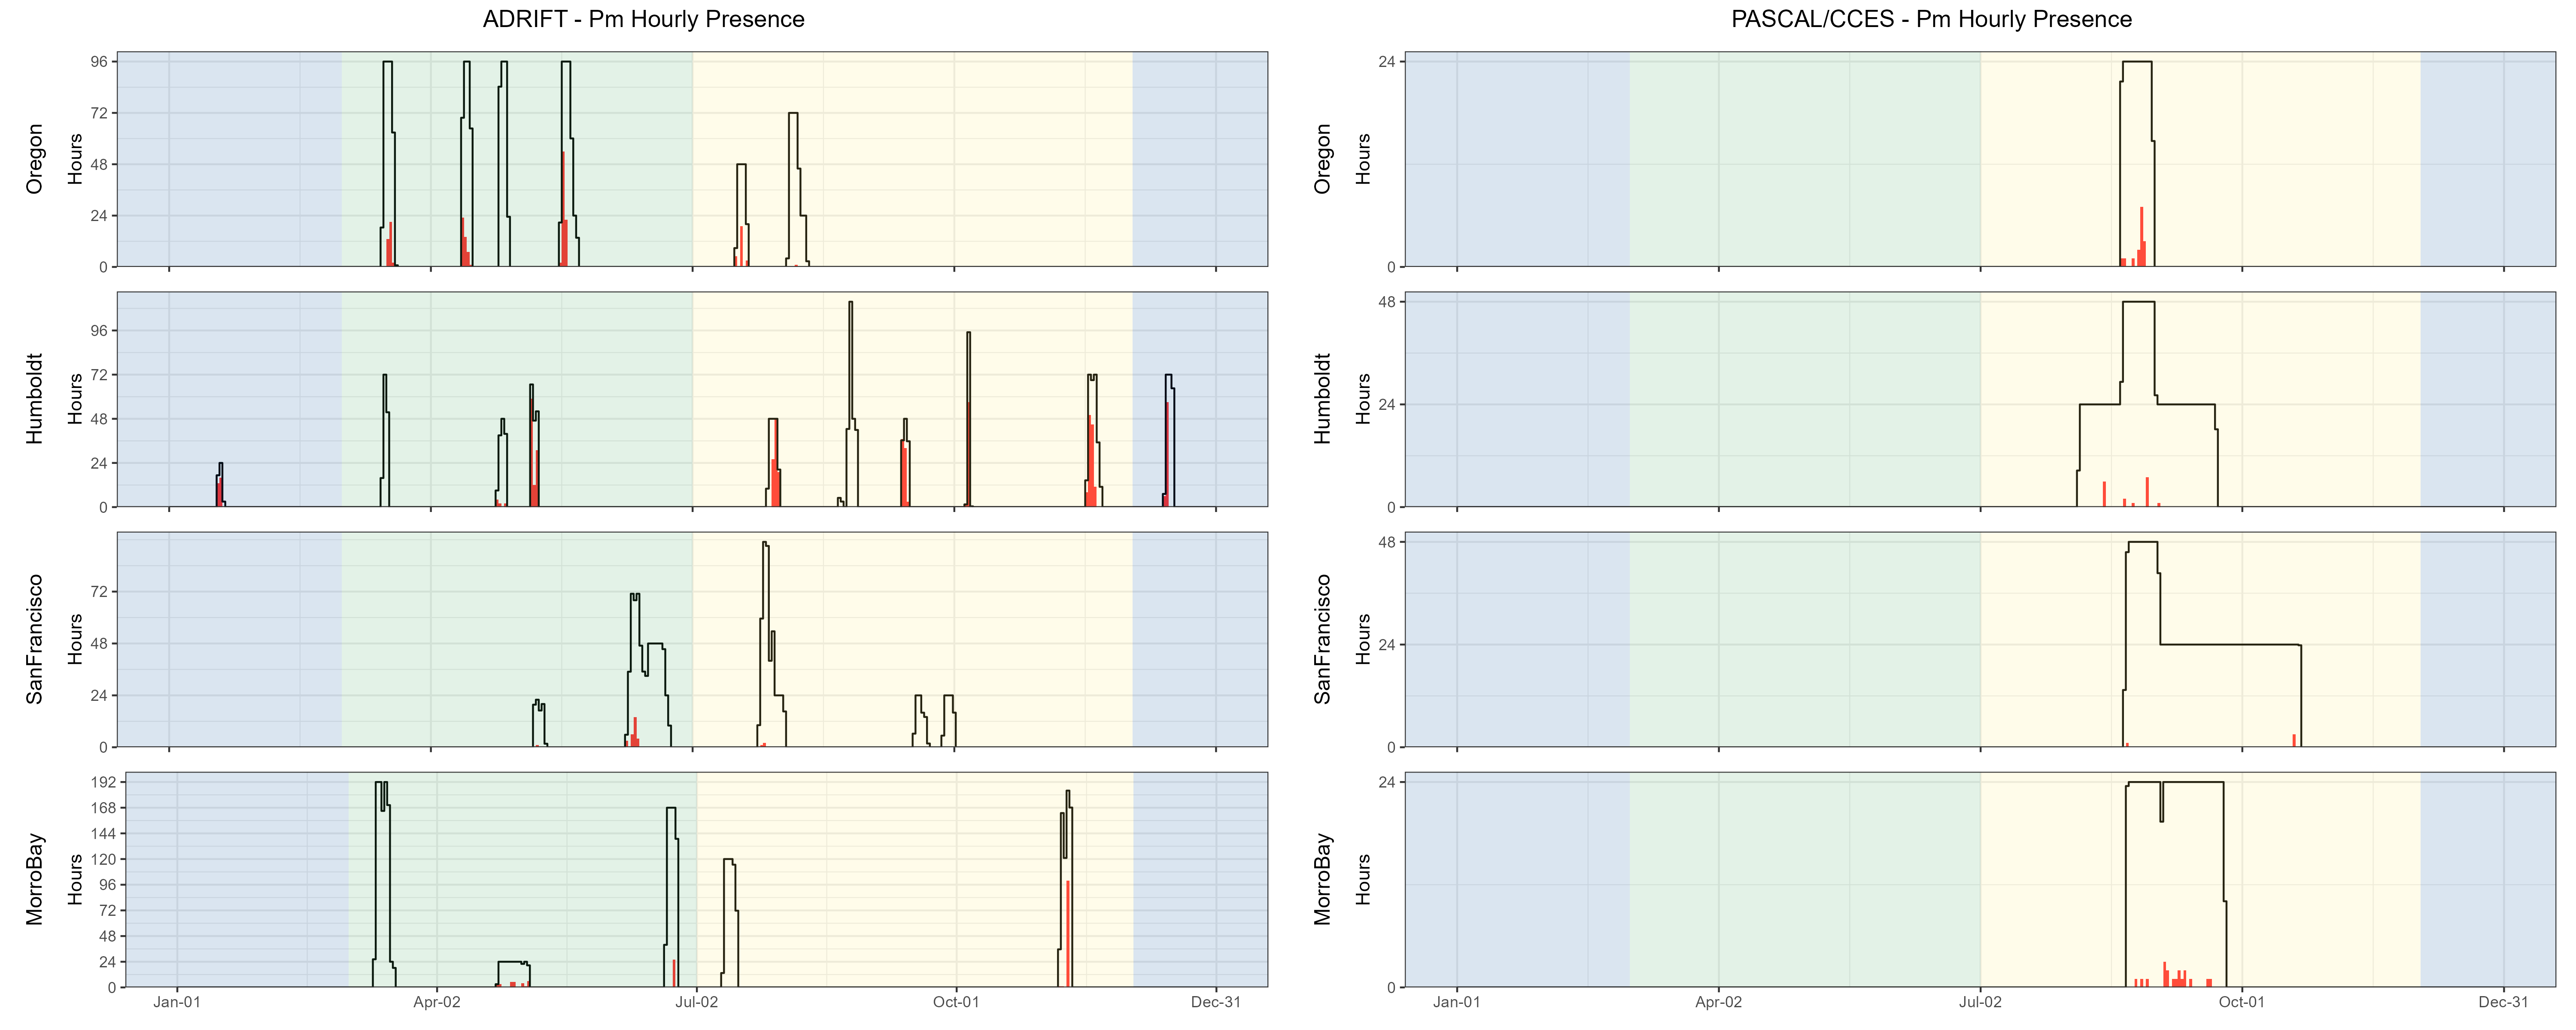
Sperm Whales
Sperm whales were detected in all regions (see table, right), with the most consistent detections and highest hourly probability of detection in the Humboldt deployments (see table, right, and Figure 1). Most sperm whale detections were ‘regular’ clicks associated with feeding animals; ‘slow’ clicks (associated with adult males) were uncommon but detected in all regions except Morro Bay (see table, right). Sperm whales were detected in all regions in PASCAL and/or CCES Surveys (Figure 1).
Sperm whales had been documented only 3 times in the waters offshore San Francisco in over 30 years of ACCESS visual surveys (J. Roletto, pers. comm.).
Our detection of sperm whales (both regular and slow clicks) from drifting recorders deployed during the ACCESS surveys suggests that passive acoustic monitoring might improve our understanding of sperm whale distribution in the busy shipping lanes off San Francisco as well as within the combined Greater Farallones and Cordell Bank National Marine Sanctuary.
A pilot study examining the potential estimation of body size based on inter-pulse and inter-click intervals found that sperm whale groups detected during November deployments in Morro Bay were comprised of females and juvenile males (see Sperm Whale Demographics). Sperm whales are protected under the endangered species act, and we recommend applying these methods to archived and future acoustic data to improve our understanding of sperm whale demographics within the regional WEAs as well as the greater California Current.
Detailed methods are provided in our Adrift Analysis Methods.
Additionally, a pilot study was conducted to investigate the potential for assessing sperm whale demographics by analyzing inter-click and inter-pulse intervals (see Sperm Whale Demographics).