| Upwelling | Post-Upwelling | Winter | |
|---|---|---|---|
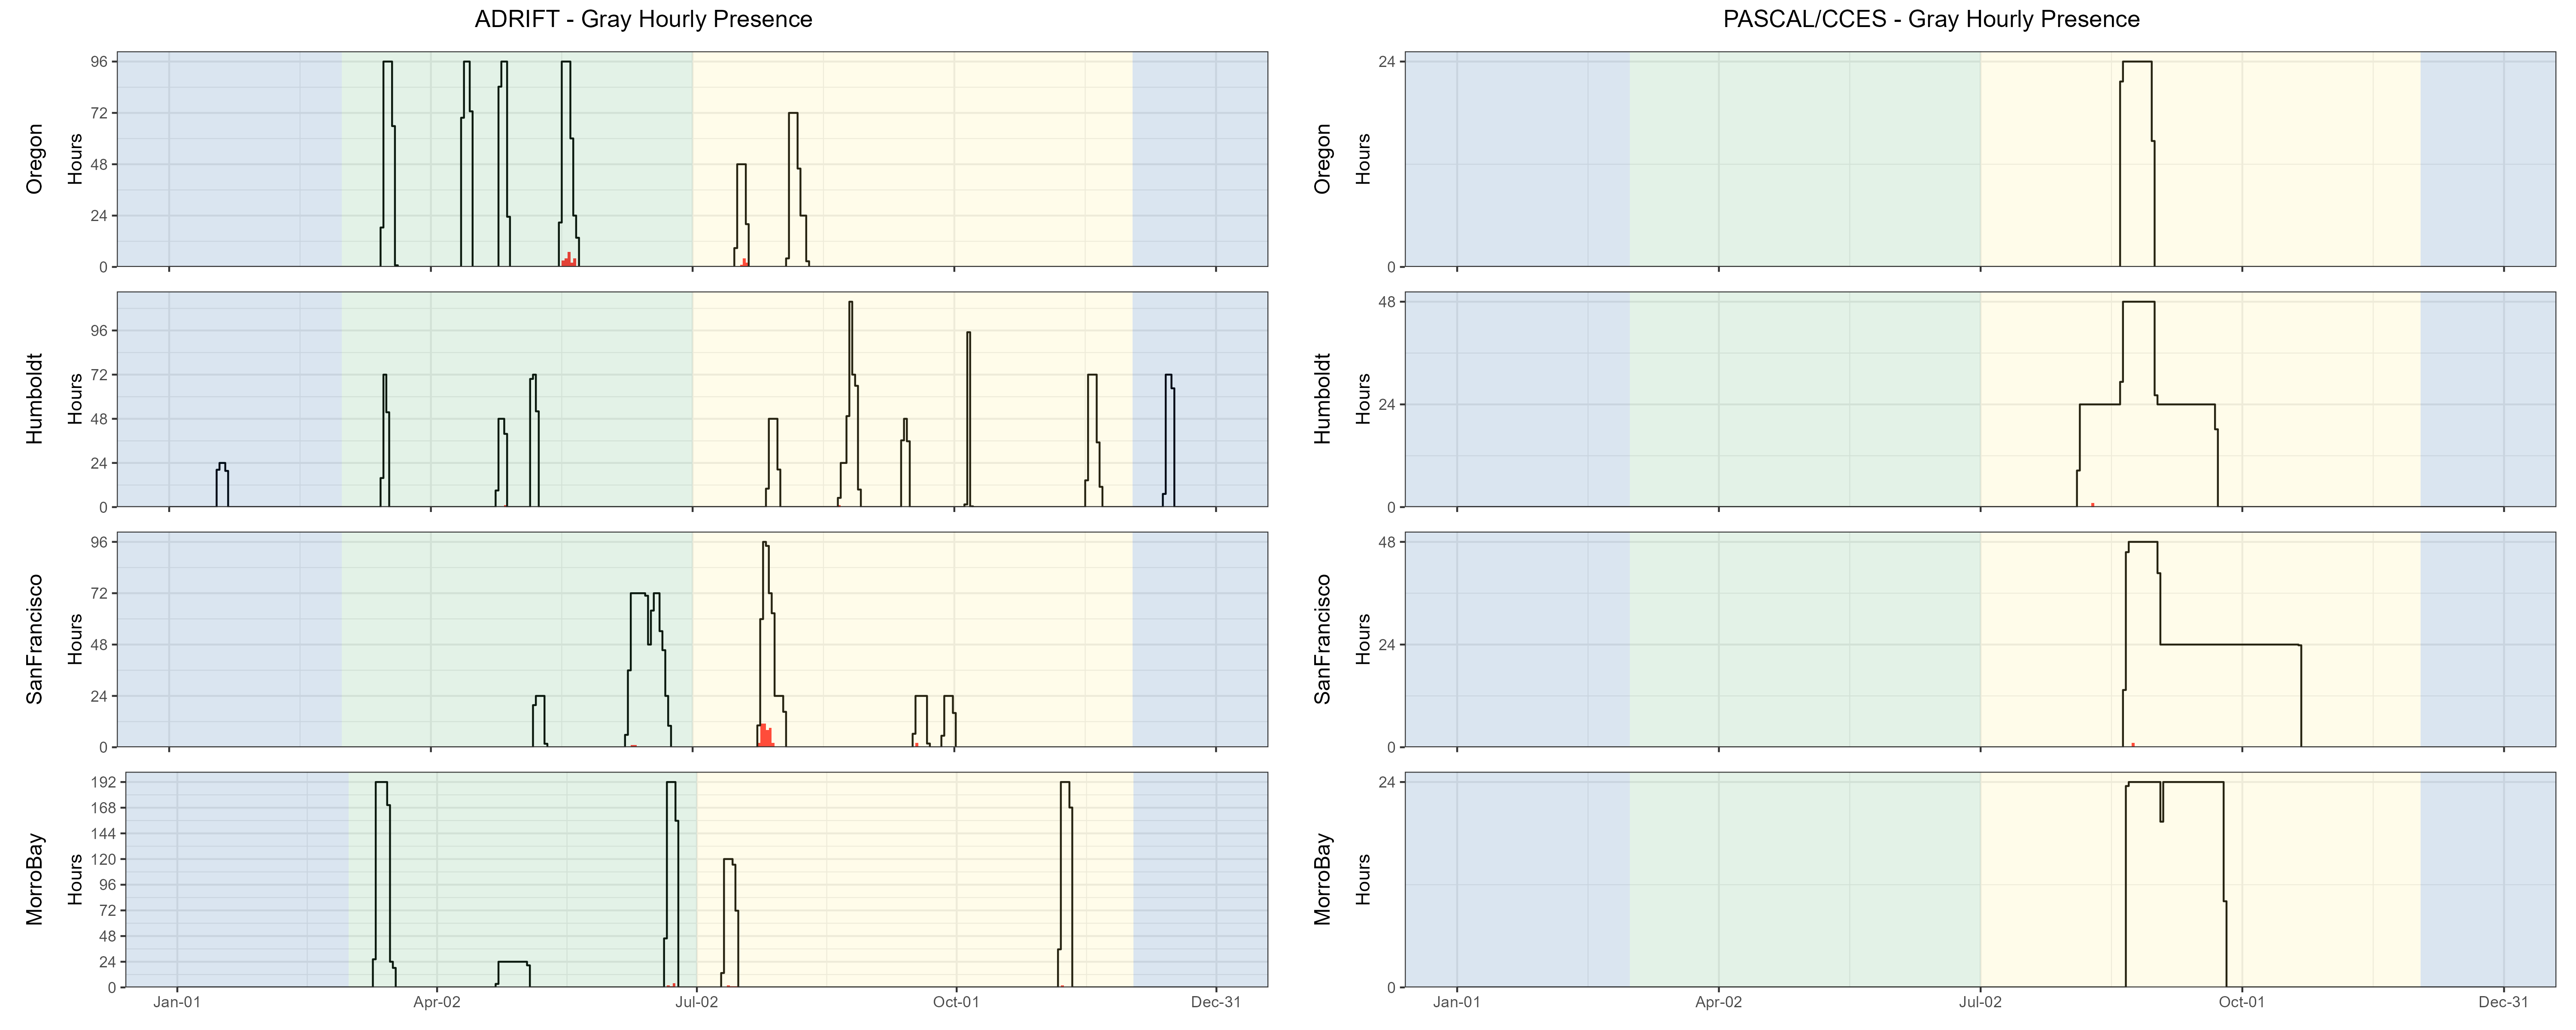
| Oregon | 0.01 (1430) | 0.01 (493) | – (–) |
| Humboldt | 0.00 (489) | 0.00 (1048) | 0.00 (308) |
| San Francisco | 0.00 (960) | 0.07 (688) | – (–) |
| Morro Bay | 0.00 (2065) | 0.01 (1353) | – (–) |
Gray Whales
Sounds associated with gray whales were only detected on a few recordings in the upwelling and post-upwelling seasons in Oregon and San Francisco regions (see table, right), and only during a few hours on the combined PASCAL and CCES surveys (Figure 1).
There is a significant overlap in spectral content for humpback and gray whale calls and most drifts were outside primary gray whale migration routes; care should be taken when inferring gray whale presence from data with concurrent humpback whale presence.
Most Eastern North Pacific gray whales use the California Current to migrate between their feeding grounds in the north and their winter breeding grounds in Baja California. A subpopulation of these whales known as the ‘Pacific Coast Feeding Group’ feed in the California Current off Northern California, Oregon, and Washington during the upwelling and post-upwelling seasons (Barlow, Strong, and Torres 2024). Gray whales are typically found in the nearshore waters, but do occur in offshore waters (see OBIS Seamap).
Detailed methods are provided in our Adrift Analysis Methods.
References
Barlow, Dawn R., Craig S. Strong, and Leigh G. Torres. 2024. “Three Decades of Nearshore Surveys Reveal Long-Term Patterns in Gray Whale Habitat Use, Distribution, and Abundance in the Northern California Current.” Scientific Reports 14 (1): 9352. https://doi.org/10.1038/s41598-024-59552-z.