Characteristic |
ADRIFT |
CCES |
PASCAL |
|---|---|---|---|
| Status | |||
| Complete | 90 (86.5%) | 15 (100.0%) | 29 (96.7%) |
| Failed | 8 ( 7.7%) | 0 ( 0.0%) | 0 ( 0.0%) |
| Unusable | 6 ( 5.8%) | 0 ( 0.0%) | 1 ( 3.3%) |
| Deployment Duration (days) | |||
| Sum | 493 | 529 | 421 |
| Median (Min - Max) | 4 (1 - 20) | 27 (5 - 80) | 19 (2 - 23) |
| Recording Duration (hours) | |||
| Sum | 8,736 | 11,022 | 9,451 |
| Median (Min - Max) | 93 (24 - 328) | 581 (125 - 1,800) | 362 (36 - 562) |
Study Area
The Adrift project surveyed the California Current between Point Conception to the south and Newport, Oregon to the north. This greater study area was subdivided into three sub-areas: Oregon, Northern California, and Central California. Initial funding (2020) focused on Northern California, ranging from San Francisco to the California-Oregon border, and encompassing the Humboldt Wind Energy Area. In 2021, funding was expanded to include Central California, with focus on the Morro Bay Wind Energy Area. Finally, in 2022 the area studied expanded to include a pilot study in Oregon. In addition to focused data collection efforts, this study analyzed data from two previous offshore surveys: Passive Acoustic Survey of Cetacean Abundance Levels (PASCAL 2016, Keating et al. (2018) ) and the California Current Ecosystem Survey (CCES 2018, Simonis (2020) ).
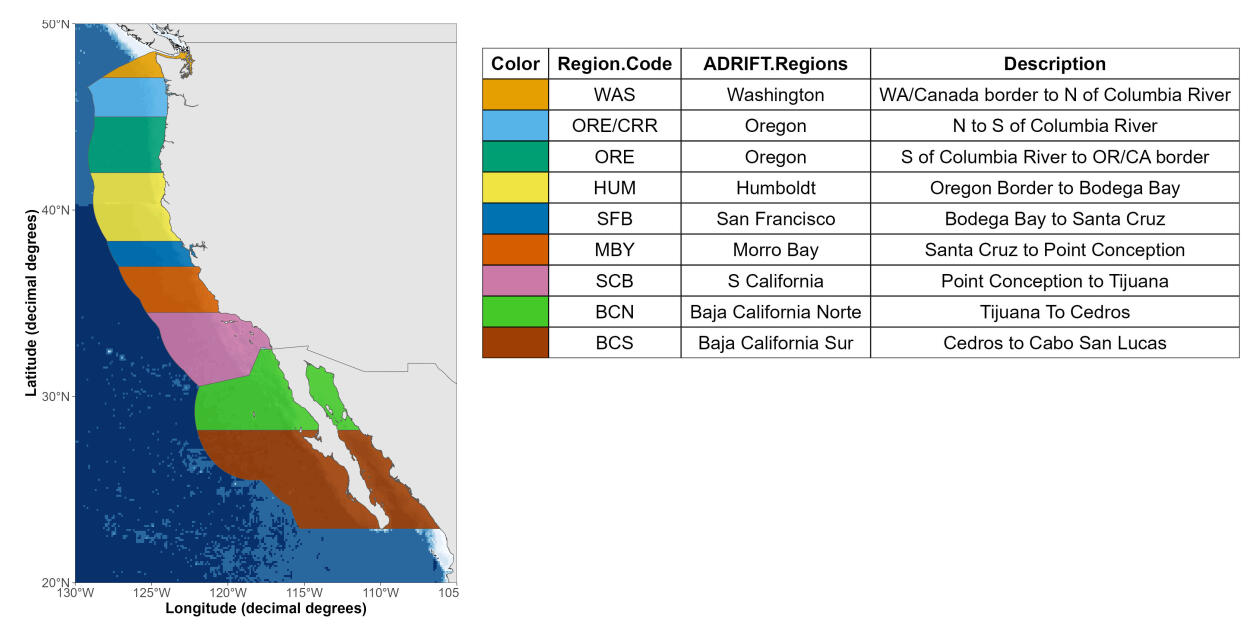
Seasonal and regional designations were selected based on those identified in (Southall, Mazurek, and Eriksen 2023). For the purpose of identifying approximate location of data collection efforts, we subdivided our larger study area into nine smaller latitudinal regions (Figure 3.1). Seasonal variation considered the oceanographic seasons designated in (Southall, Mazurek, and Eriksen 2023): upwelling (March - June), post-upwelling (July - November), and winter (December - February).
The Adrift project started in June 2020, during the COVID-19 Pandemic. All fieldwork in 2020 was canceled due to the pandemic, and these impacts greatly hampered research efforts in 2021. In addition to the initial cessation of all fieldwork efforts, secondary impacts continued to negatively impact fieldwork well into 2022. Secondary impacts included disruptions to the supply chain and extreme short-staffing due to outbreaks and exposure, as well as the widespread post-pandemic changes to the workforce.
Prior research efforts include the 2016 PASCAL survey and the 2018 CCES survey. These surveys were conducted in late summer through late fall during the post-upwelling season and data collection was not impacted by strong currents or inclement weather. Weather conditions are typically less ideal, and currents stronger, during the upwelling and winter season. The California Current experienced three consecutive years of La Niña between 2020-2022 (Thompson et al. 2024). The increased wind and currents caused by these conditions led to decreased windows of good weather, even during summer. After the initial loss of several drifting recorders due to extreme weather and current conditions, we limited our deployments to good weather windows, which dramatically decreased the duration of our deployments from ~ 30 days during PASCAL (10-19 days) and CCES (10-79 days), to less than 1 week during most of the Adrift study. Strong currents and high seas also created self-noise such as strumming, which periodically impacted data quality. Use of spar buoys instead of hi-flyer pole buoys may be preferred to minimize strumming.
The cumulative impacts of the pandemic and poor environmental conditions ultimately required us to shift our survey approach and abandon our efforts to coordinate data collection using vessels of opportunity. Instead, we focused on directed deployment of drifting recorders in collaboration with regional partners. Our partners in Humboldt (Cal Poly Humboldt) and Oregon (Oregon State University) were able to use a combination of opportunistic and dedicated vessel time for data collection. We partnered with the NOAA Sanctuary Applied California Current Ecosystem Studies (ACCESS) Surveys to collect data offshore San Francisco up to three times per year, and developed a collaborative partnership for fieldwork in Morro Bay.
A total of 90 drifting recorders were successfully deployed during the Adrift survey, for a total of 493 deployment days which resulted in a total of 8,736 hours of recordings (see table, above, and Figure 2). Analysis included additional recordings from the 2016 PASCAL Survey (29 successful drifting recorders for a total of 421 deployment days and 9,451 hours of recordings) and the 2018 CCES Survey (15 successful drifting recorders for a total of 529 deployment days and 11,022 hours of recordings). Expanded deployment details are provided in Appendix A, Appendix B, Appendix C.
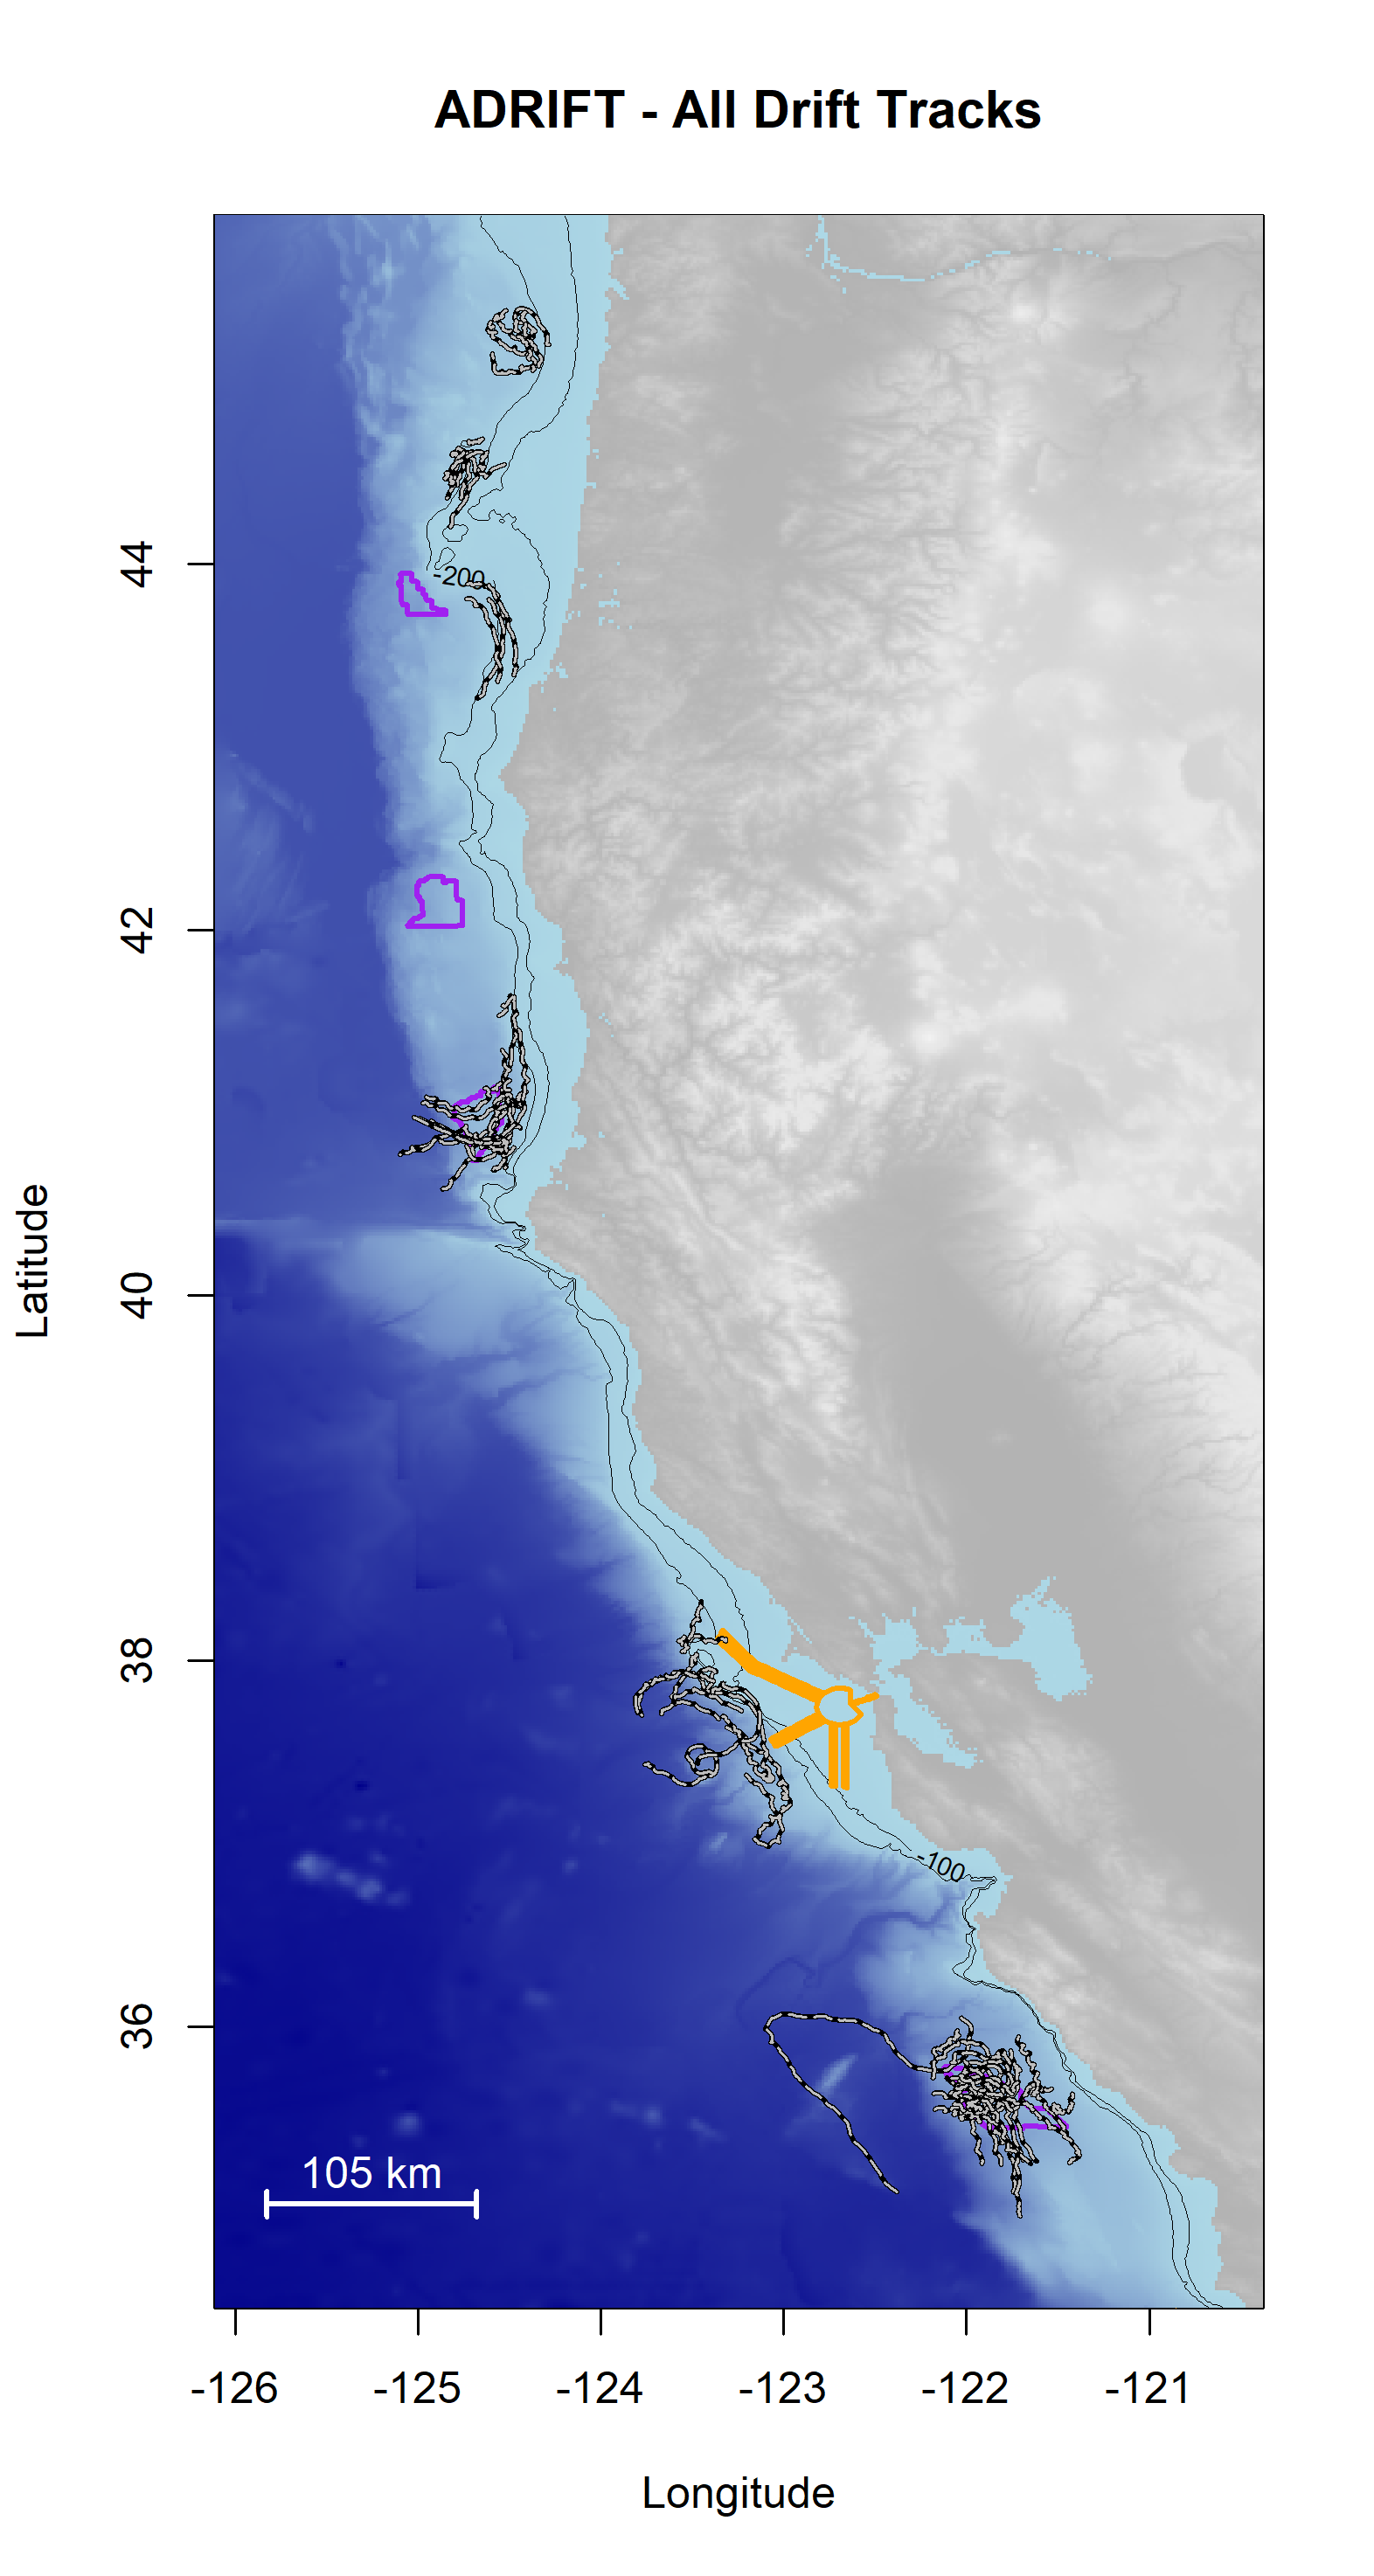
The primary focal regions included areas of importance to the initial phases of offshore renewable wind energy development, including two locations in Oregon (Coos Bay to the North, and Brookings to the South), Humboldt, and Morro Bay, with sampling of San Francisco as opportunity allowed (Figure 3.2). The 100 m and 200 m isobaths are shown on the maps to identify the shelf break and potential for increased biological activity associated with upwelling (Figure 3.2 and regional maps). Regional description of partners and data collection efforts will be presented from the northern region (Oregon) to the southern region (Morro Bay).
Oregon
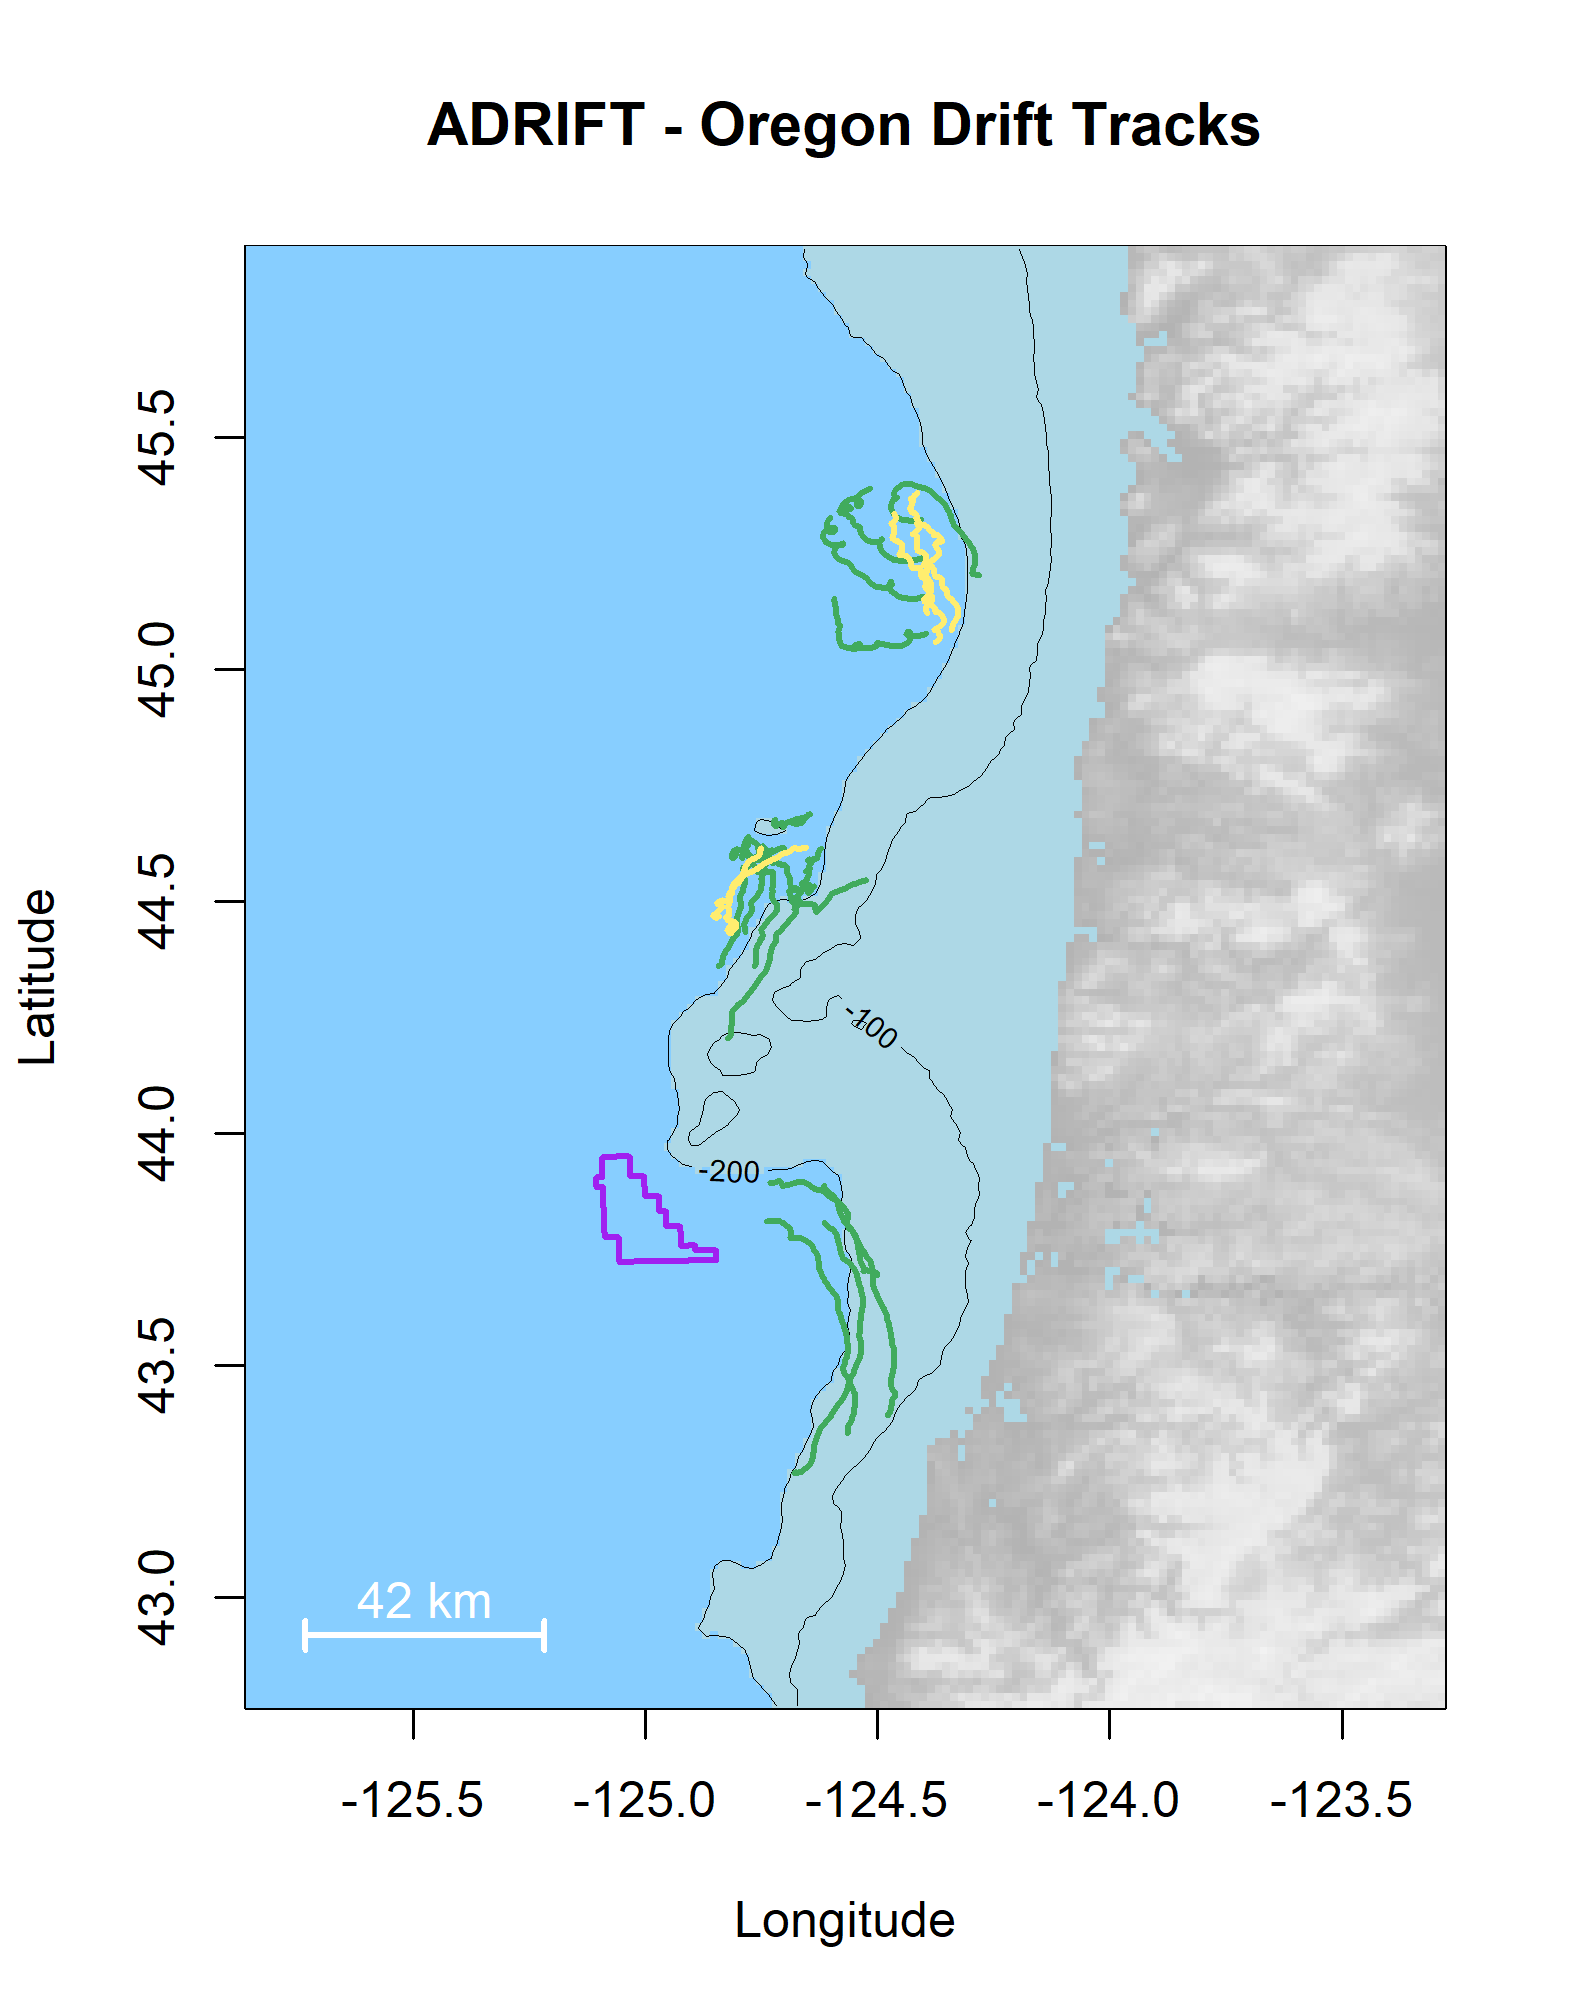
We collaborated with Oregon State University to conduct a pilot study offshore Oregon in order to understand if data collection using drifting recorders could be conducted in this study area (Figure 3). Our partners were able to deploy a cluster of 4 drifting recorders at least monthly between March and August 2023 (21 total deployments), using both opportunistic and dedicated surveys. More information is provided in the Adrift GitHub Repository Supplement folder.
Humboldt
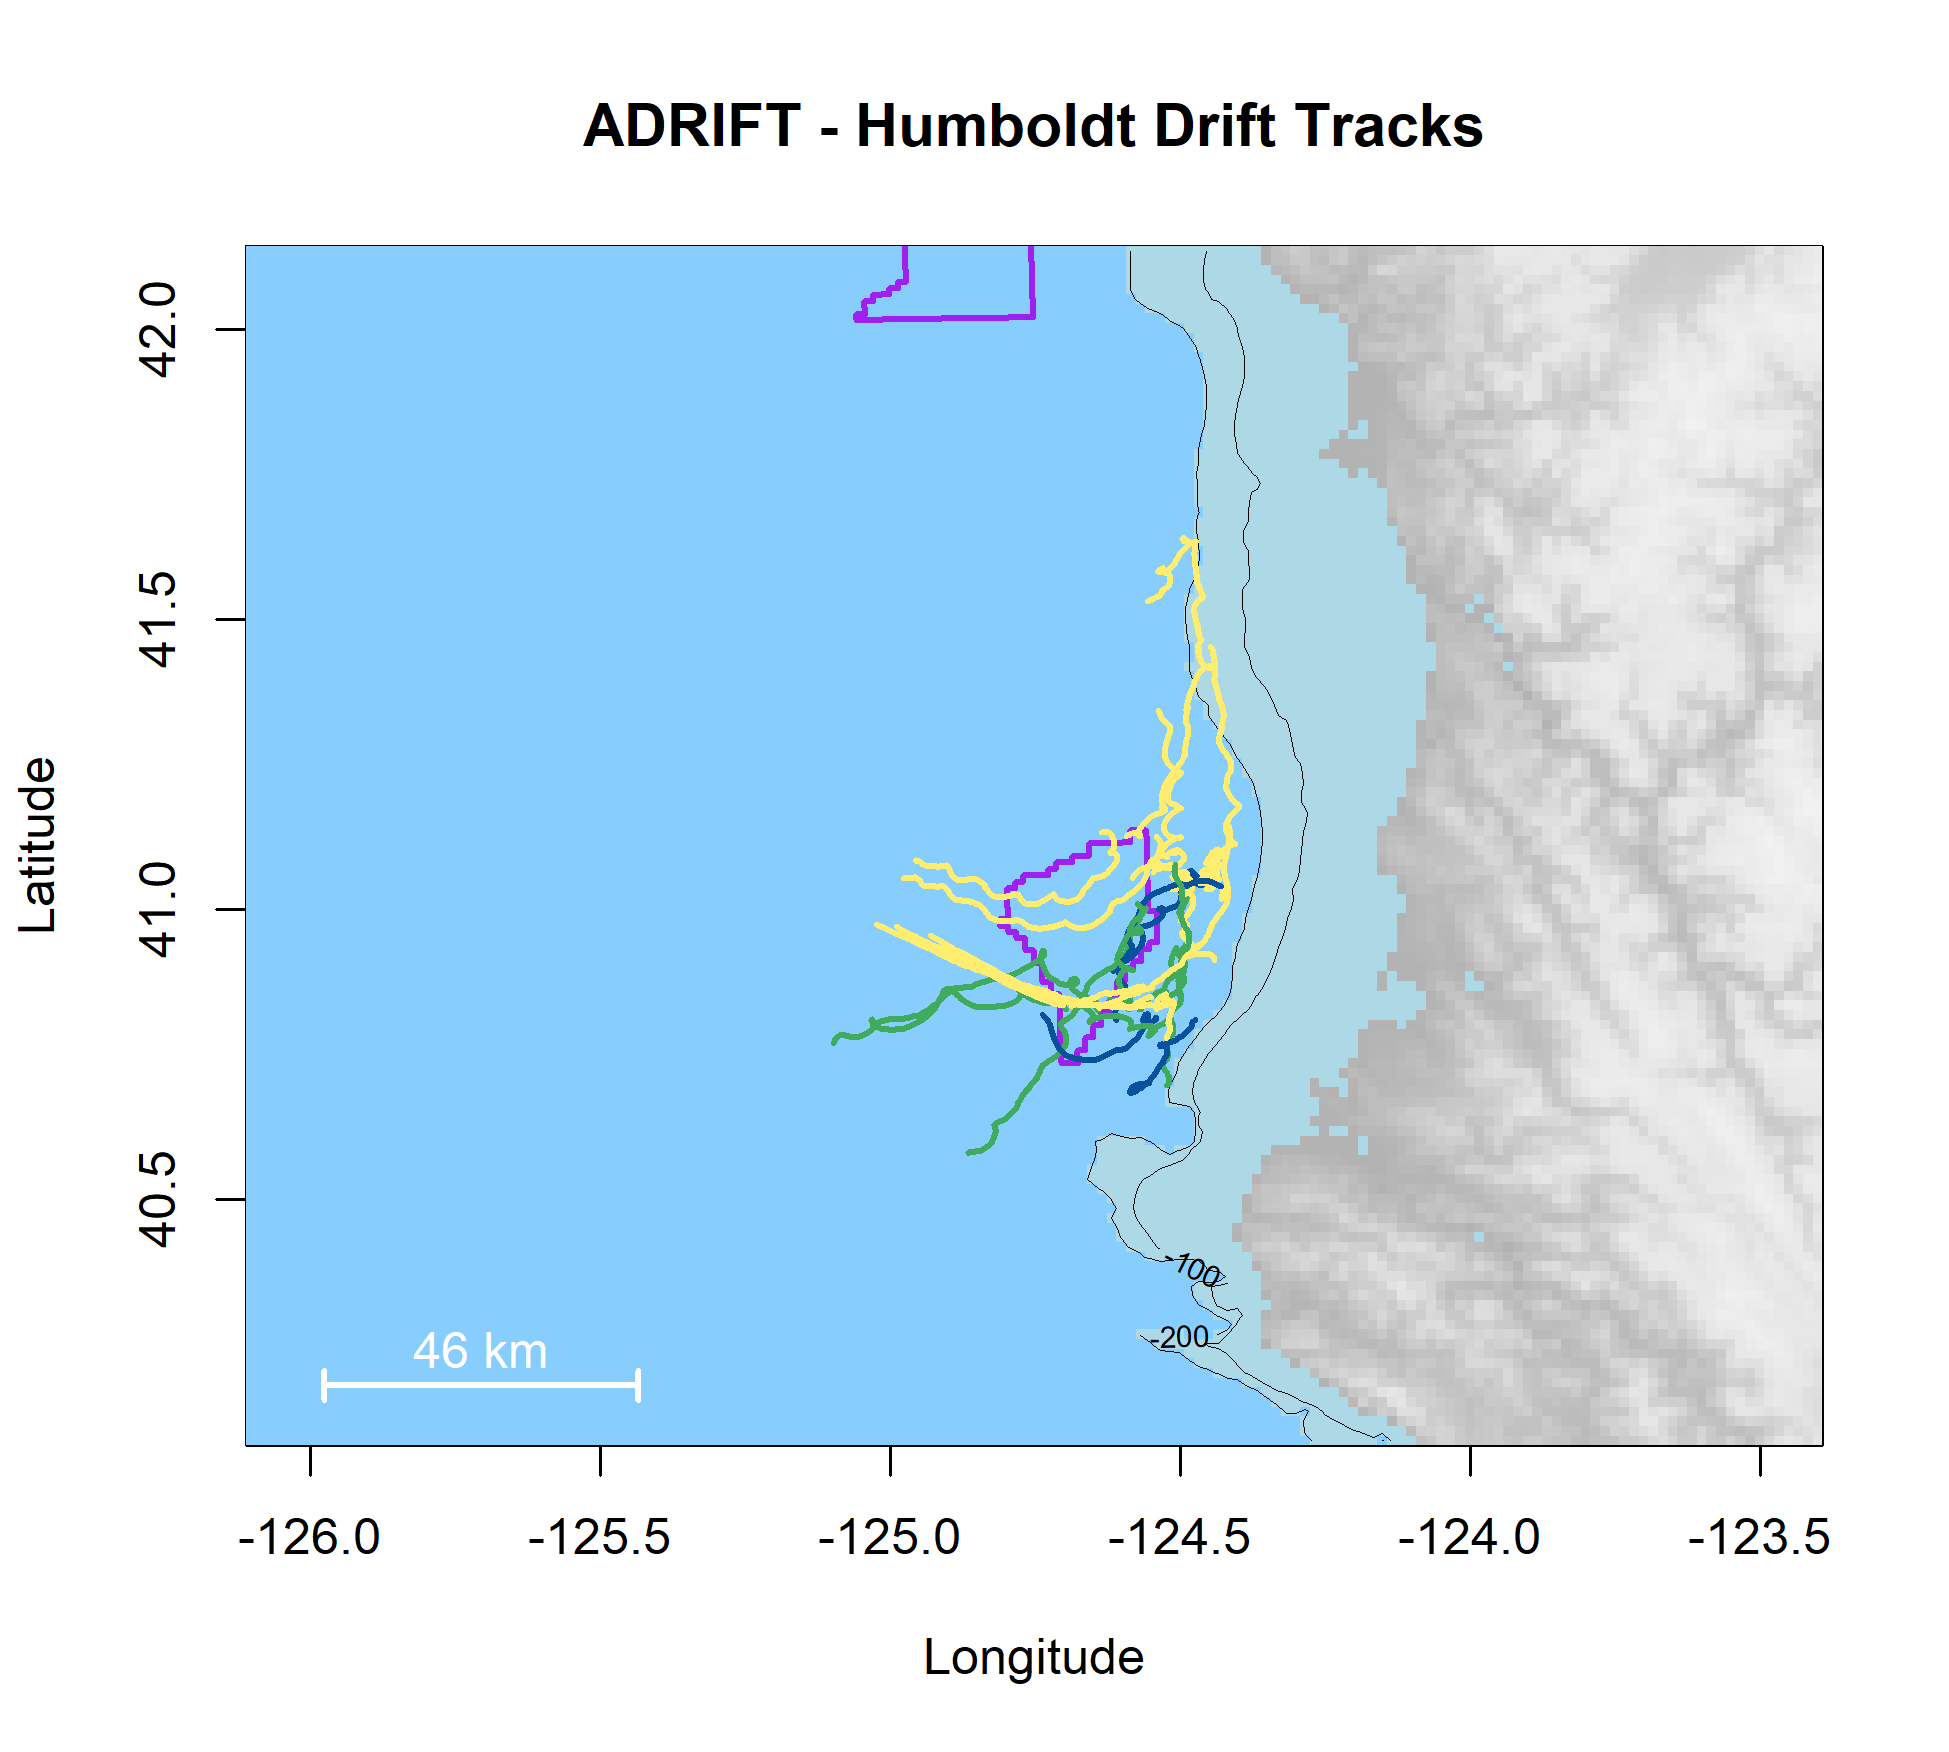
Adrift data collection in the Humboldt region was coordinated with our partners at Cal Poly Humboldt (Figure 4). The first drifting recorder was deployed in fall 2021, with more frequent deployment of clusters of 2-4 buoys starting in spring 2022 (28 total deployments).
Drifting recorders had previously been deployed in the Humboldt region during the 2018 CCES survey (See CCES Expanded Datasets) and the 2019 Express Pilot Survey. Both previous drifts were entrained in the recirculating current offshore Humboldt (Largier, Magnell, and Winant 1993) that allowed for repeated sampling during each deployment. Unfortunately, during the Adrift survey these drifting recorders encountered strong southward currents that prevented the repeated sampling provided during previous surveys. The extreme weather conditions, variable currents, and proximity to Cape Mendocino (and lack of ports south of this point) created a high-risk scenario. After the loss of 3 drifting recorders in the first survey year, we reduced deployments to open weather windows to ensure opportunity for retrieval.
The monthly Trinidad Head Line survey provides year-round ship observations of oceanography (hydrographic and biological) and terminates just inside the boundary of the Humboldt WEA. Efforts to deploy monthly during these surveys were complicated by personnel shortages and poor environmental conditions, and deployments were frequently shortened due to prevailing environmental conditions. Data collection in Humboldt was negatively impacted by competition for resources (vessel and seaboard technician time) and poor weather conditions, especially during the winter months. The increasing need for offshore research in the Humboldt WEA combined with the University’s new status as a polytechnic institution suggest collaborative field efforts such as those conducted in Morro Bay may be welcome.
San Francisco
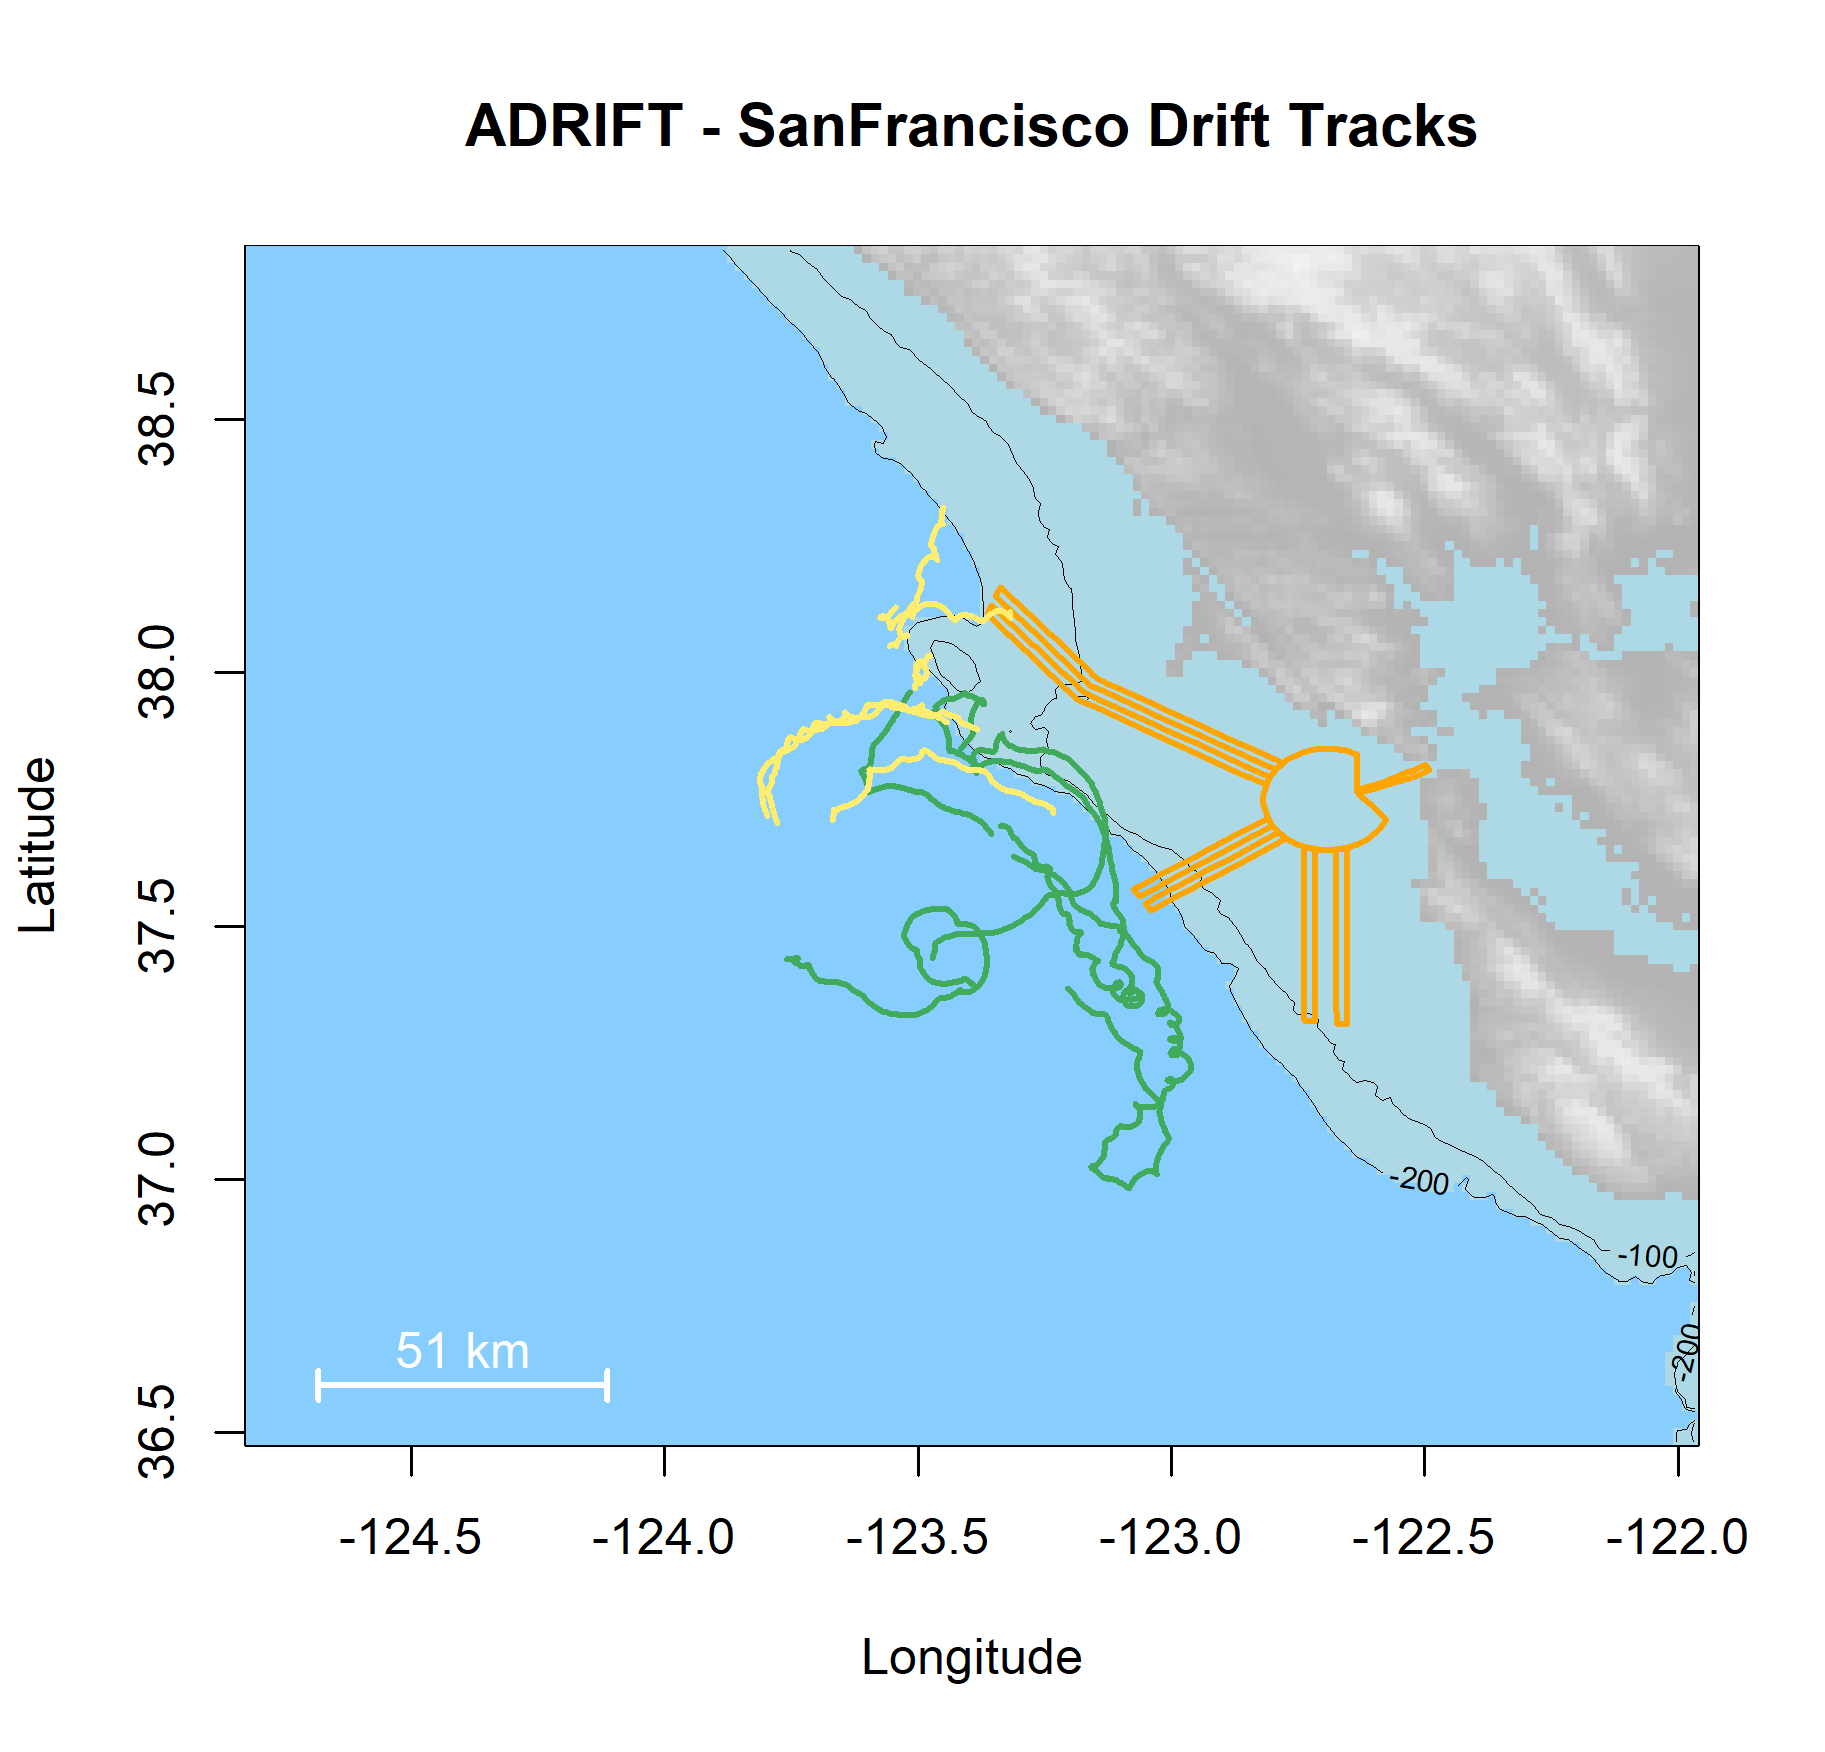
We partnered with the Greater Farallones and the Cordell Bank National Marine Sanctuaries and Point Blue to participate in their tri-annual ACCESS surveys. These surveys provided an opportunity to deploy and retrieve 1-2 drifting recorders in the area offshore San Francisco Bay, providing data to inform the Sanctuaries and to provide an additional dataset between the Morro Bay and Humboldt WEAs (total 11 deployments, Figure 5). This partnership was mutually beneficial; however, these surveys are only conducted in late spring through late summer. Deployments in the post-upwelling season extended further south than deployments in the upwelling season (Figure 5); these geographic differences may contribute to seasonal differences in marine mammal detections.
Morro Bay
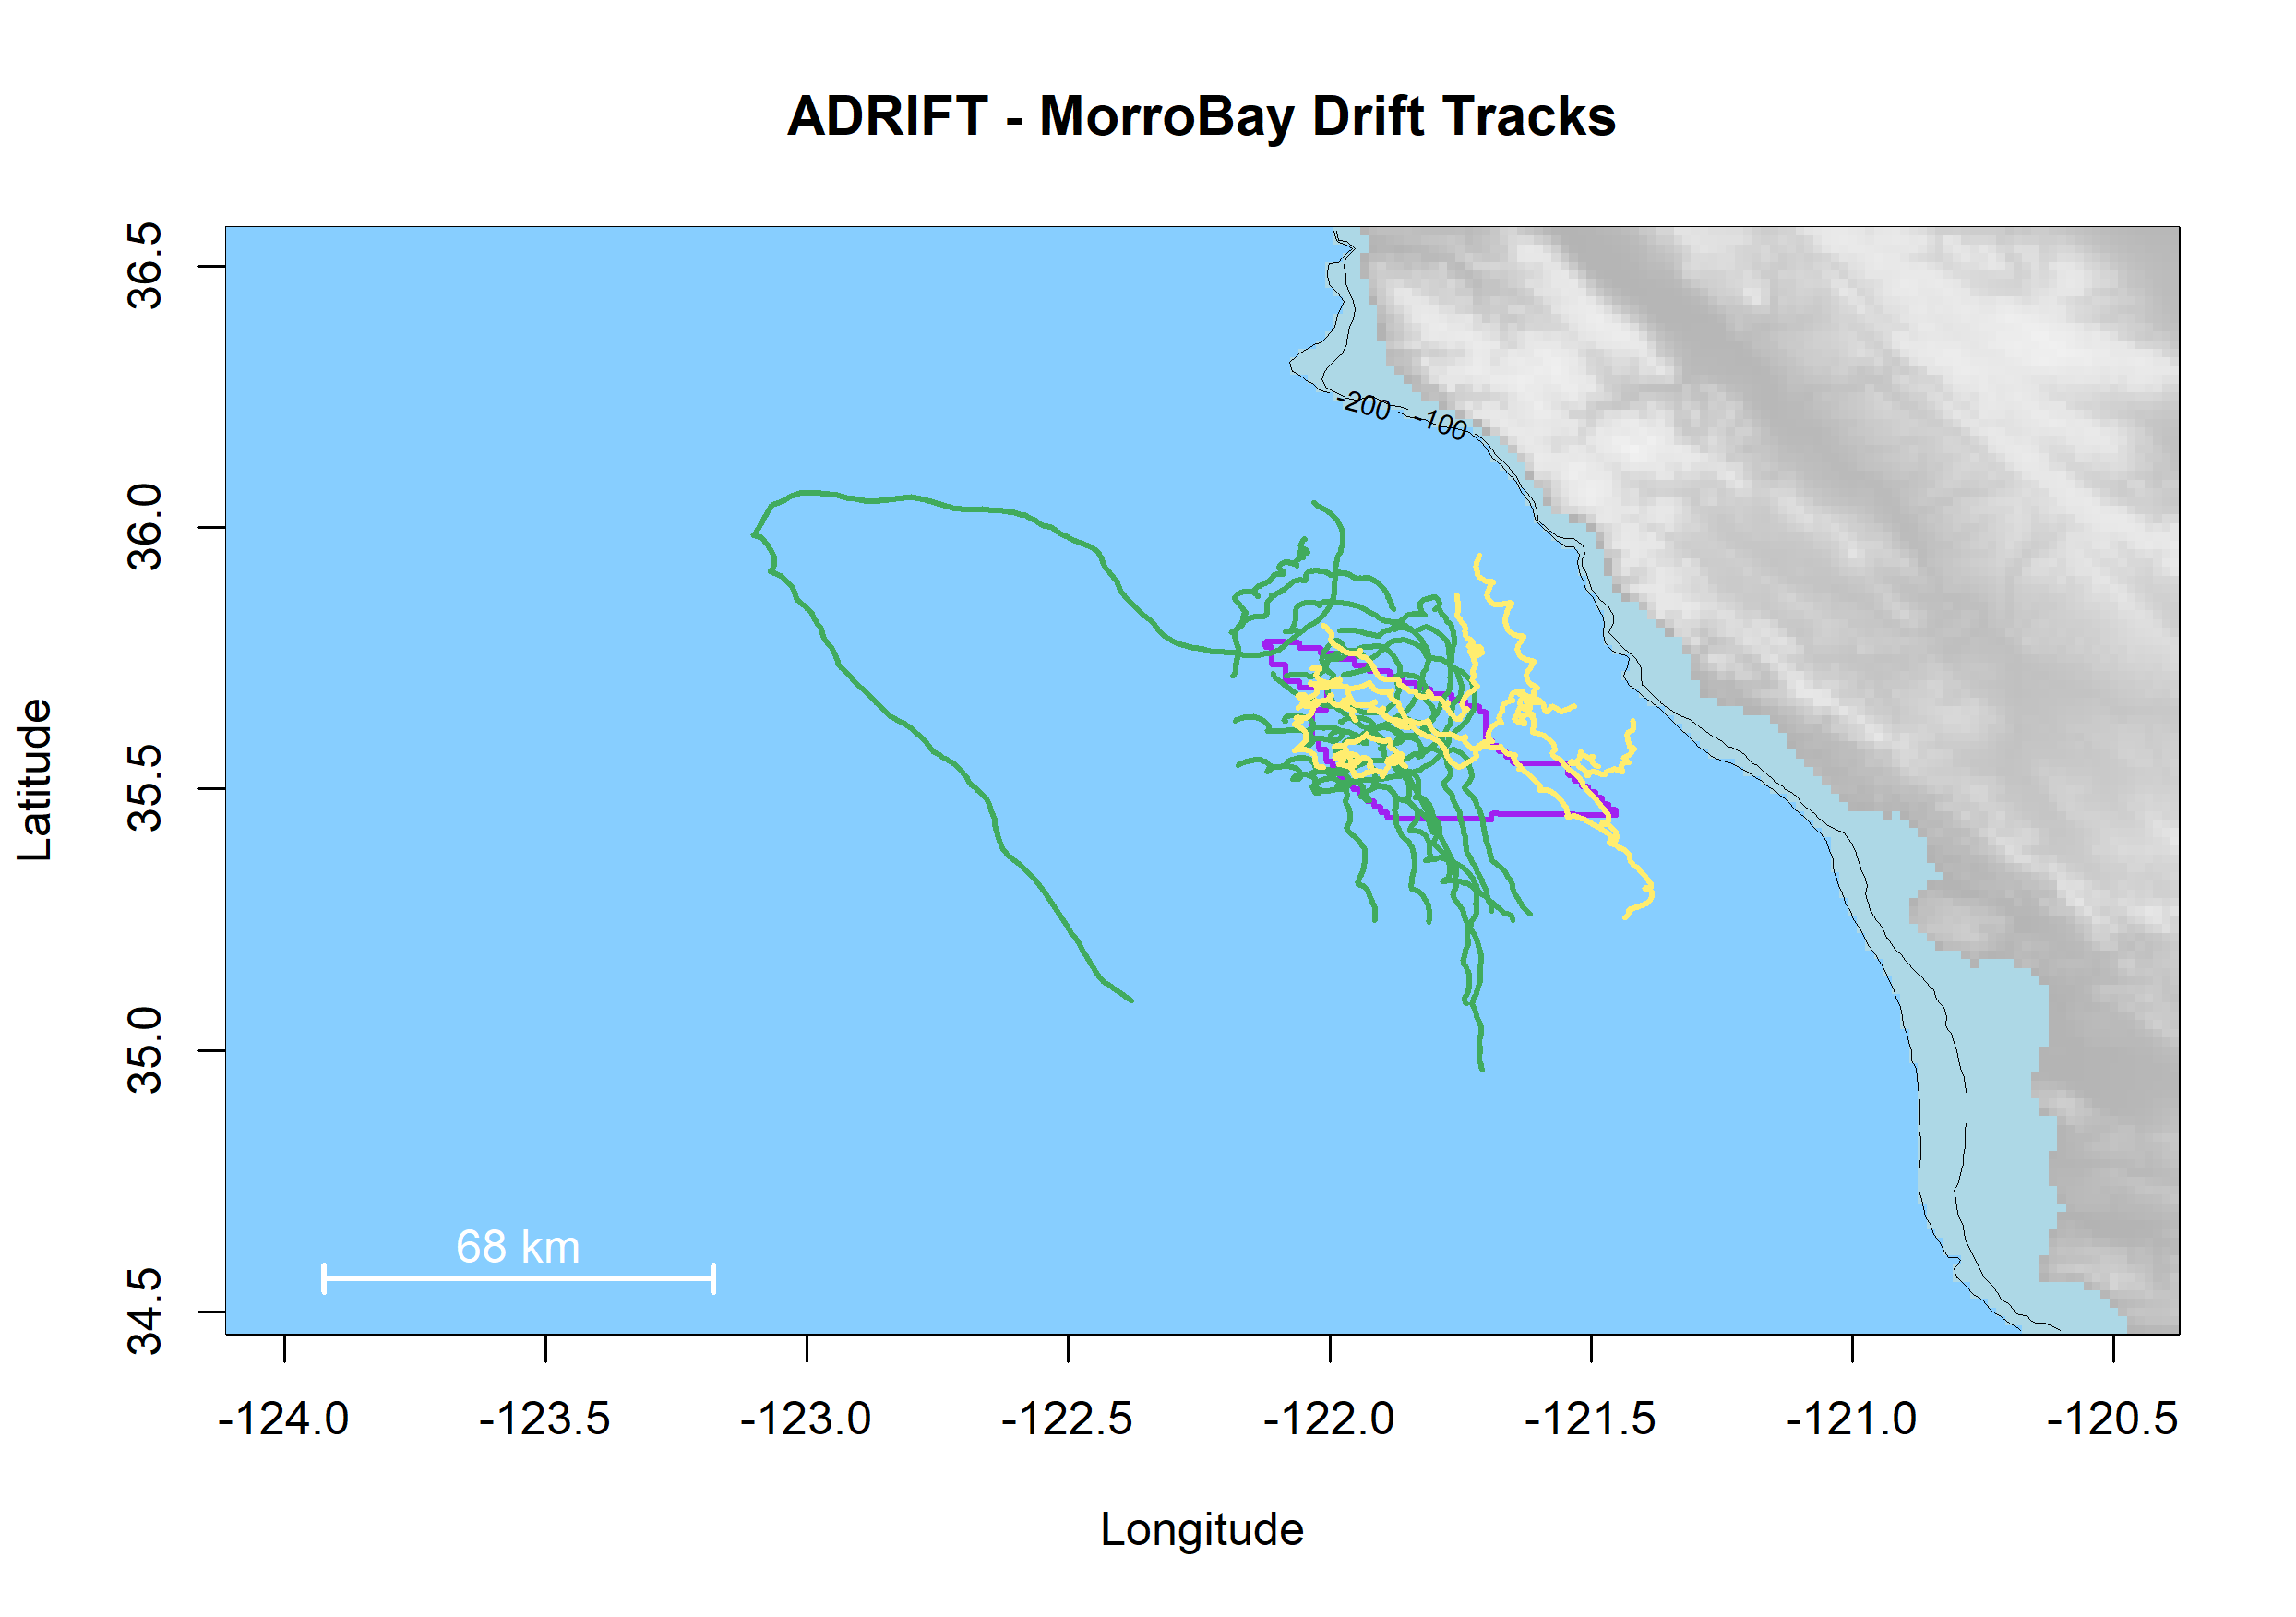
The Morro Bay WEA is located offshore the remote coastal region of Big Sur, south of Monterey Bay and north of the small harbor at Morro Bay. We had difficulty identifying suitable partners for this remote study area and the high cost of vessel charters in the Morro Bay region led us to seek what resulted in a highly successful collaboration with regional scientific partners. After a successful pilot study in June 2022, we initiated the seasonal Central Coast Collaborative passive acoustic monitoring survey (CCC). These highly successful surveys brought together scientists, educators, tribal representatives, and regional community members to collect data, form collaborations, and strengthen bonds across communities to better serve our combined priorities. These surveys allowed us to collect data from clusters of eight drifting recorders during each survey, providing improved geographic coverage during these seasonal surveys. We conducted a total of four CCC surveys with a total of 30 Adrift deployments (Figure 6).
References
Keating, Jennifer, Jay Barlow, Emily T. Griffiths, and Jeffrey E. Moore. 2018. “Passive Acoustics Survey of Cetacean Abundance Levels (PASCAL-2016) Final Report.” https://www.boem.gov/sites/default/files/environmental-stewardship/Environmental-Studies/Pacific-Region/Studies/BOEM-2018-025.pdf.
Largier, J. L., B. A. Magnell, and C. D. Winant. 1993. “Subtidal Circulation over the Northern California Shelf.” Journal of Geophysical Research: Oceans 98 (C10): 18147–79. https://doi.org/10.1029/93JC01074.
Simonis, Anne E. 2020. “Passive Acoustic Survey Of Deep-Diving Odontocetes in the California Current Ecosystem 2018: Final Report.” NOAA-TM-NMFS-SWFSC-630. https://doi.org/10.25923/W5XX-JZ73.
Southall, Brandon, Robert Mazurek, and Rikki Eriksen. 2023. “Vulnerability Index to Scale Effects of Offshore Renewable Energy on Marine Mammals and Sea Turtles Off the u.s. West Coast (VIMMS).” Aptos, CA. https://espis.boem.gov/Final%20Reports/BOEM_2023-057.pdf.
Thompson, Andrew R., Rasmus Swalethorp, Michaela Alksne, Jarrod A. Santora, Elliott L. Hazen, Andrew Leising, Erin Satterthwaite, et al. 2024. “State of the California Current Ecosystem Report in 2022: A Tale of Two La Niñas.” Frontiers in Marine Science 11 (February). https://doi.org/10.3389/fmars.2024.1294011.