\usepackage[here]

Soundscape

The purpose of soundscape monitoring was to describe the ambient noise level(s) in the California Current Ecosystem (including the Morro Bay and Humboldt Wind Energy Areas) and to identify the major contributors to the soundscape. To that end, we measured soundscape metrics and identified two primary sources of noise: self-noise and ship noise. Weather (wind, rain) is a significant contributor to soundscape and varies by season/region. Although we did not quantify this in our analysis, we recommend that future research include weather as a contributor to the soundscape. These data were combined with the detection of biological sounds from marine mammals to examine the biological and anthropogenic contributors to the soundscape. Soundscape metrics aligned with SanctSound protocols and were measured using Triton (Wiggins and Hildebrand 2007) with the Soundscape Remora. Data were decimated to 48 kHz, and LTSAs were calculated with a 1 Hz, 1 s resolution. The full system calibration value was calculated from the combined hydrophone and SoundTrap sensitivity. Soundscape LTSAs were used to calculate sound levels in 2-minute windows from 100 - 24,000 Hz, including broadband sound pressure levels, third-octave levels, and power spectral densities. Median (50th percentile), mean, and various statistical sound levels (1st, 5th, 10th, 25th, 75th, 90th, and 95th percentiles) are calculated for each metric. Soundscape metrics were archived to NCEI and linked with the original raw data.

The SanctSound methods were initially adopted to provide data consistent with previously analyzed data. Soundscape methods have changed significantly in the last three years, and the most recent recommendation is to report sound levels in hybrid millidecade bands. While there is now open-source software that can produce these metrics, it was not available for our analysis. All of our data is publicly available and the LTSAs were retained so that the data can be converted in the future. We recommend that data be reanalyzed to report sound levels in hybrid millidecade bands to align with current standards.

Periods of low frequency self-noise (strumming, knocking sounds resulting from movement of buoy components) were identified by scanning the 1- or 2-hour LTSA windows created with 500 Hz decimated files (5 Hz and 1 s resolution). Start and end times of noisy data were logged with the highest frequency affected (up to the 250 Hz maximum provided by the 500 Hz decimated data). Noisy data with energy above the 100 Hz lower bounds of the soundscape methods were removed from analysis. Additional details are provided in Github online analysis methods.

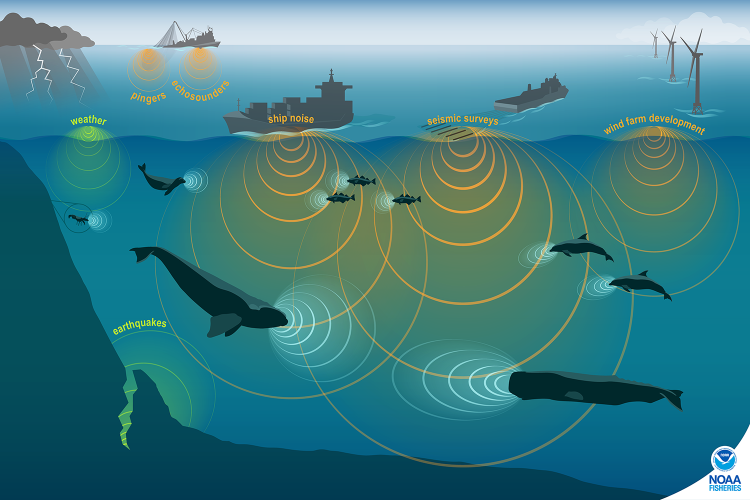
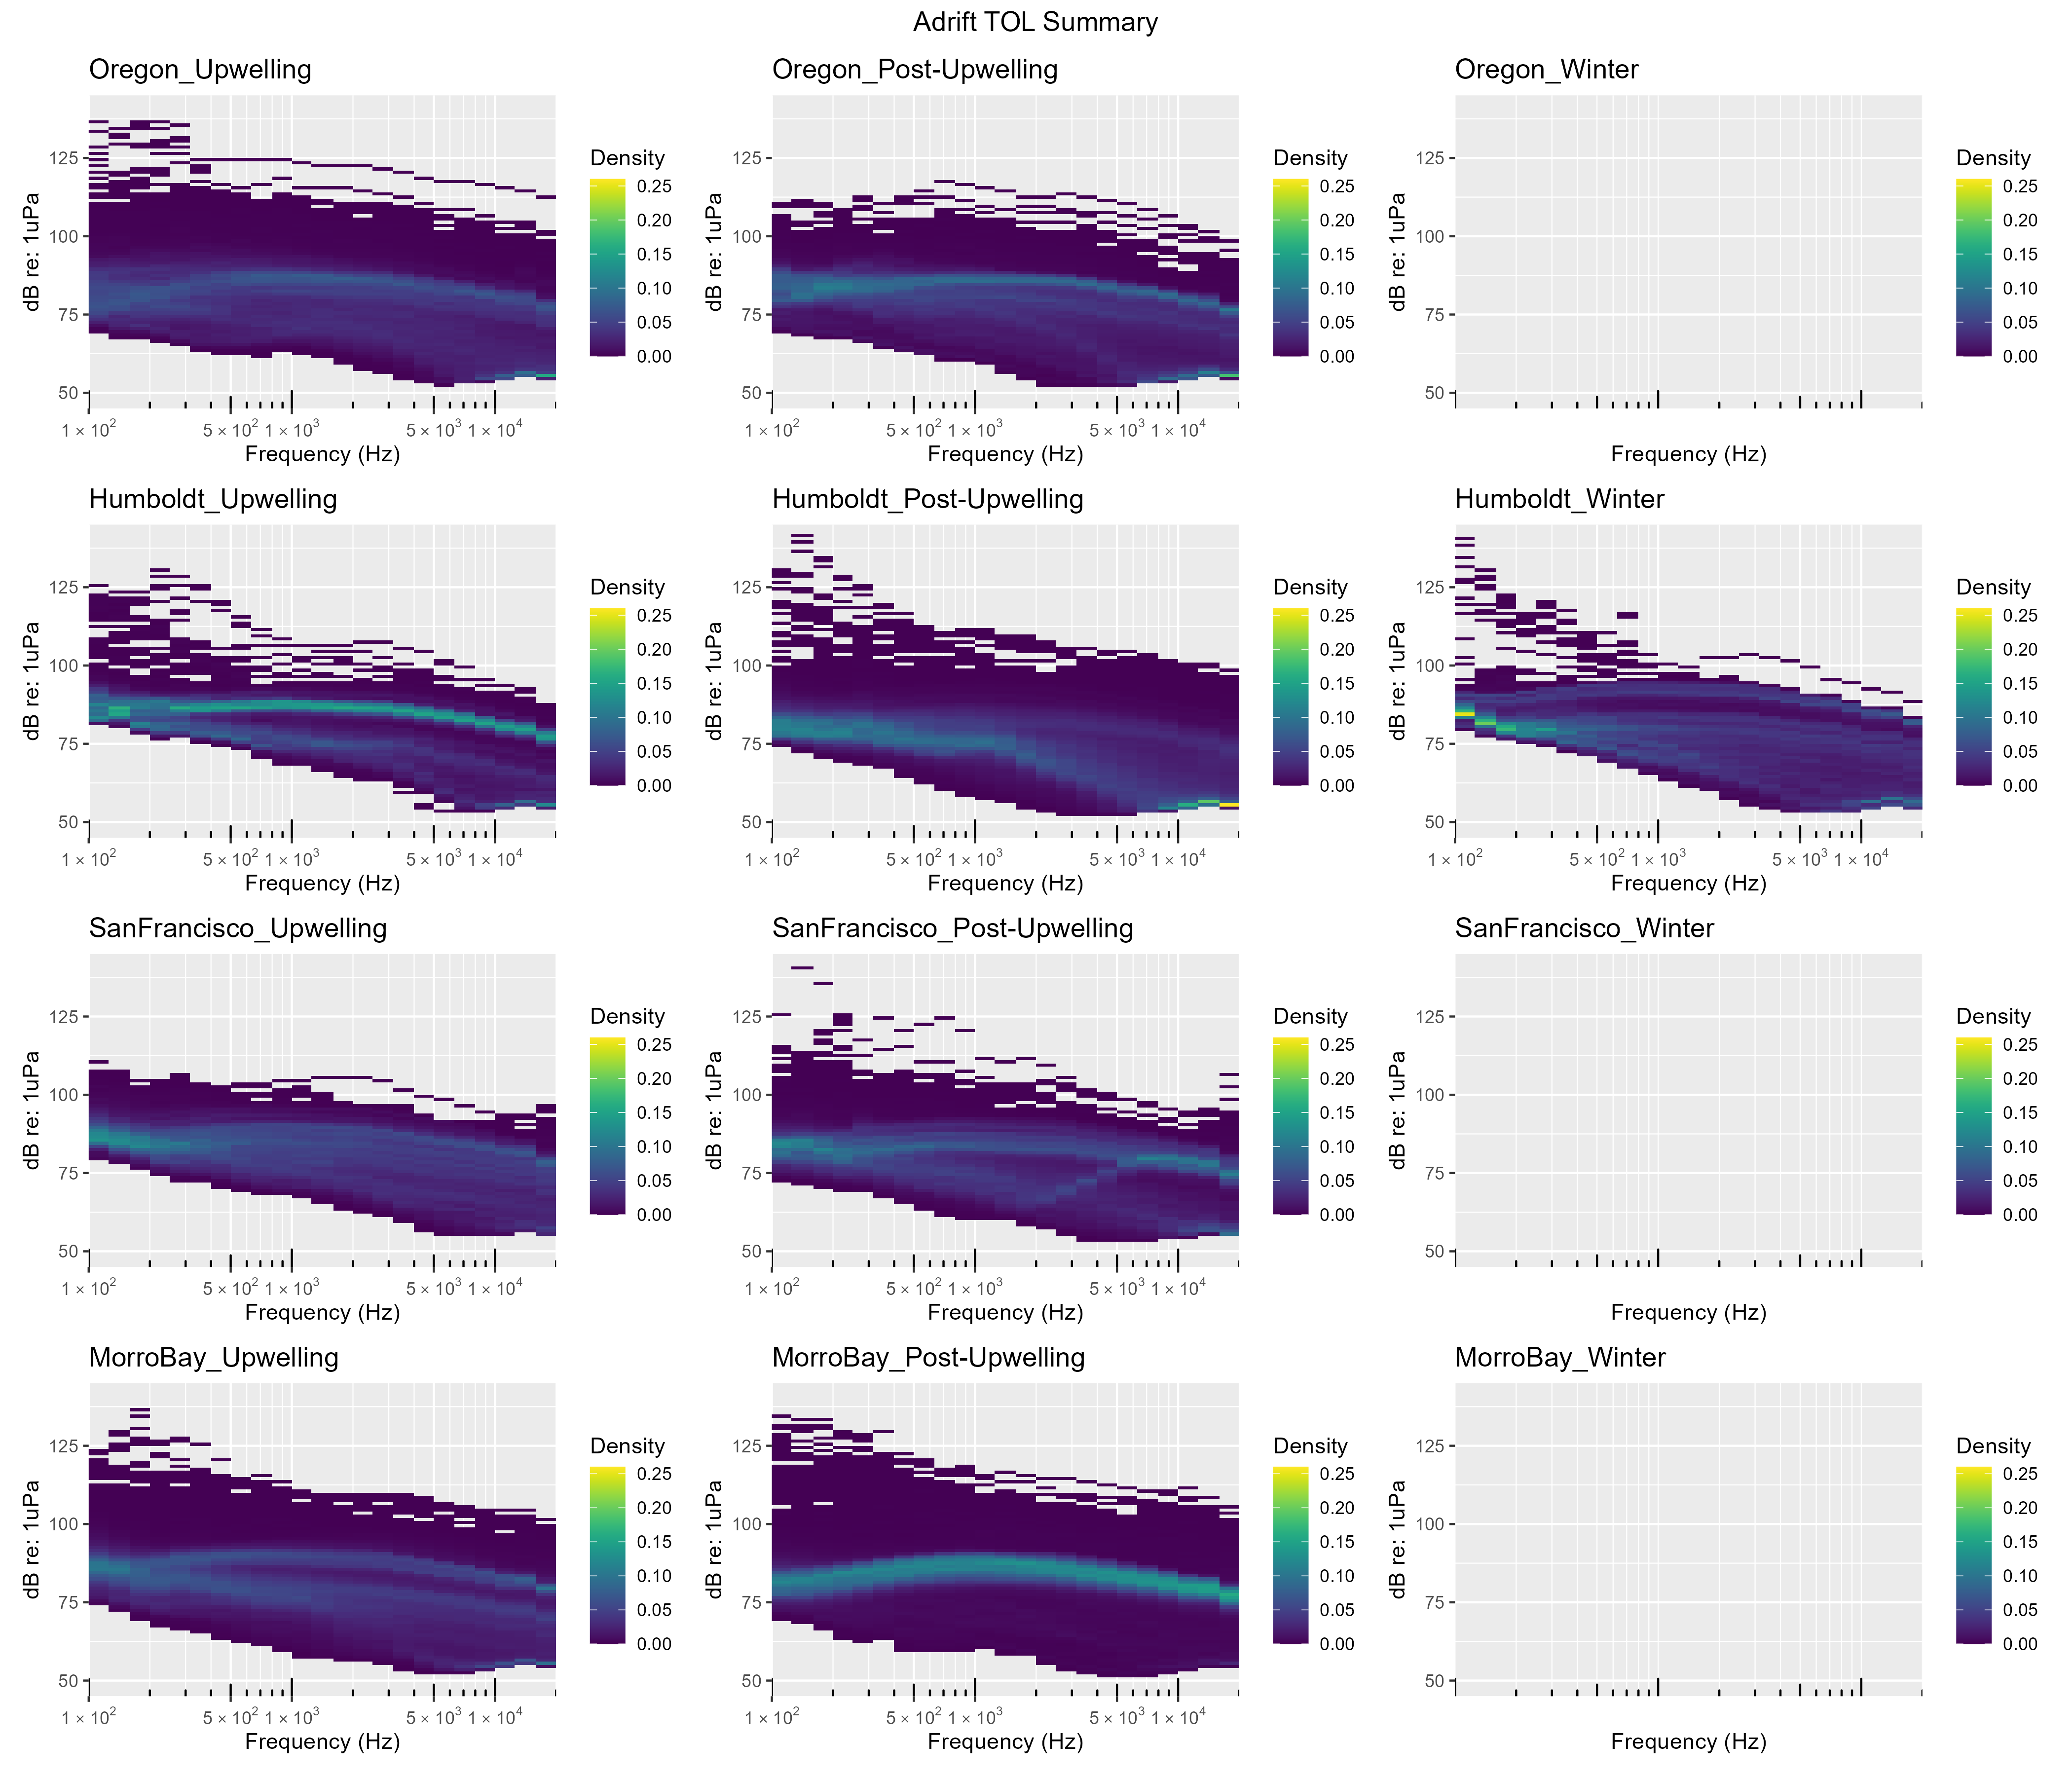
The Power Spectral Density (PSD) is the measure of the signal’s power as a function of frequency, and the PSD plots provide a visualization of the ambient noise for each region and season (Figure 6.1). Contributing sounds include biological sounds (marine mammals, fish, invertebrates), environmental noise (wind, rain), and anthropogenic noise (vessel noise, depth sounders, seal bombs). While Figure 6.1 includes all contributors to the soundscape, seasonal and regional differences can be informative and provide valuable pre-development information regarding the general soundscape. In general, noise levels ranged from 50 dB re 1uPa to nearly 150 dB re 1uPa, with the highest density of sound in the 75 - 100 dB range (Figure 6.1).

Power spectral density (PSD) plots shown by season (upwelling on left, post-upwelling in center, and winter on right) and region (Oregon at top, then Humboldt, San Francisco, and Morro Bay at the bottom). Each PSD plot shows the intensity in dB re: 1uPa on the y axis and frequency in Hz on the x axis. The density is shown as color, ranging from dark blue (0) to bright yellow (0.25). These plots include biological, geological, and anthropogenic contributors to the soundscape, and seasonal/regional variation may be attributed to local factors including storms, highly vocal species, or close passage of vessels.
Figure 1: Power spectral density for Adrift deployments by season and region.

Other researchers have developed models to separate the distinct contributions of ship and wind noise to soundscapes (Erbe et al. 2021; ZoBell et al. 2024). These models have been validated with empirical data and can be in close agreement in certain times and places, but validation has been very limited to small spatiotemporal scales. The data collected in offshore waters throughout the California Current by drifting recorders during PASCAL, CCES, and Adrift surveys can be used to validate models which separate wind and shipping contributions to sound levels. This will be an important next step for evaluating changes in the soundscape associated with offshore wind development areas.

Low frequency noise associated with strumming precluded consistent analysis of soundscape below 100Hz. Future drifting recorder studies should consider alternative configurations that eliminate strumming and other self-noise to allow for broadband soundscape analysis.