| Drift ID | Site | Status | Deployment | Retrieval | Recording Specifications | Data Start Date | Data End Date | |||||||
|---|---|---|---|---|---|---|---|---|---|---|---|---|---|---|
| Date | Lat | Long | Date | Lat | Long | Recorder | SR (kHz) | Duty Cycle | HP Depth (m) | |||||
| CCES_004 | HUM | Complete | 2018-07-25 | 45.08 | −128.21 | 2018-10-13 | 41.76 | −127.15 | SM3M | 256 | 2 min per 20 | 100 | 2018-07-30 | 2018-10-12 |
| CCES_007 | HUM | Complete | 2018-08-05 | 41.26 | −125.02 | 2018-10-22 | 42.04 | −124.48 | ST4300HF | 288 | 2 min per 20 | 150 | 2018-08-05 | 2018-09-22 |
| CCES_008 | HUM | Complete | 2018-08-16 | 38.95 | −126.64 | 2018-10-10 | 34.38 | −128.32 | ST4300HF | 288 | 2 min per 20 | 150 | 2018-08-16 | 2018-10-01 |
| CCES_010 | PTA | Complete | 2018-08-22 | 36.76 | −125.06 | 2018-10-22 | 35.97 | −122.94 | ST4300HF | 576 | 2 min per 20 | 150 | 2018-08-22 | 2018-10-21 |
| CCES_012 | MOB | Complete | 2018-08-30 | 34.83 | −123.81 | 2018-10-06 | 34.03 | −124.39 | ST4300HF | 288 | 2 min per 20 | 150 | 2018-08-30 | 2018-10-06 |
| CCES_013 | CHI | Complete | 2018-09-11 | 33.90 | −120.91 | 2018-10-23 | 31.44 | −119.78 | ST4300HF | 288 | 2 min per 20 | 150 | 2018-09-11 | 2018-10-23 |
| CCES_014 | BCN | Complete | 2018-10-05 | 32.27 | −118.26 | 2018-11-01 | 31.95 | −119.25 | ST4300HF | 576 | 2 min per 20 | 150 | 2018-10-05 | 2018-11-01 |
| CCES_016 | BCN | Complete | 2018-10-30 | 31.35 | −117.42 | 2018-11-21 | 32.13 | −118.03 | ST4300HF | 576 | 2 min per 10 | 150 | 2018-10-30 | 2018-11-15 |
| CCES_017 | BCN | Complete | 2018-10-31 | 30.73 | −118.69 | 2018-11-24 | 28.29 | −118.44 | SM3M | 256 | 2 min per 4 | 100 | 2018-10-31 | 2018-11-24 |
| CCES_018 | BCN | Complete | 2018-10-31 | 30.01 | −120.18 | 2018-11-23 | 29.51 | −118.82 | ST4300HF | 576 | 2 min per 6 | 150 | 2018-10-31 | 2018-11-16 |
| CCES_019 | BCN | Complete | 2018-11-01 | 30.05 | −117.46 | 2018-11-27 | 28.40 | −115.55 | ST4300HF | 576 | 2 min per 10 | 150 | 2018-11-01 | 2018-11-18 |
| CCES_020 | BCN | Complete | 2018-11-05 | 29.46 | −118.39 | 2018-11-22 | 29.39 | −116.34 | ST4300HF | 576 | 2 min per 10 | 150 | 2018-11-05 | 2018-11-22 |
| CCES_021 | BCN | Complete | 2018-11-06 | 29.47 | −116.01 | 2018-11-11 | 29.82 | −116.08 | ST4300HF | 576 | 2 min per 6 | 150 | 2018-11-06 | 2018-11-11 |
| CCES_022 | BCN | Complete | 2018-11-07 | 28.72 | −116.48 | 2018-11-27 | 28.28 | −116.68 | ST4300HF | 576 | 2 min per 10 | 150 | 2018-11-07 | 2018-11-23 |
| CCES_023 | BCN | Complete | 2018-11-22 | 30.93 | −117.38 | 2018-12-03 | 31.05 | −119.01 | ST4300HF | 576 | 2 min per 5 | 150 | 2018-11-22 | 2018-12-03 |
CCES Data
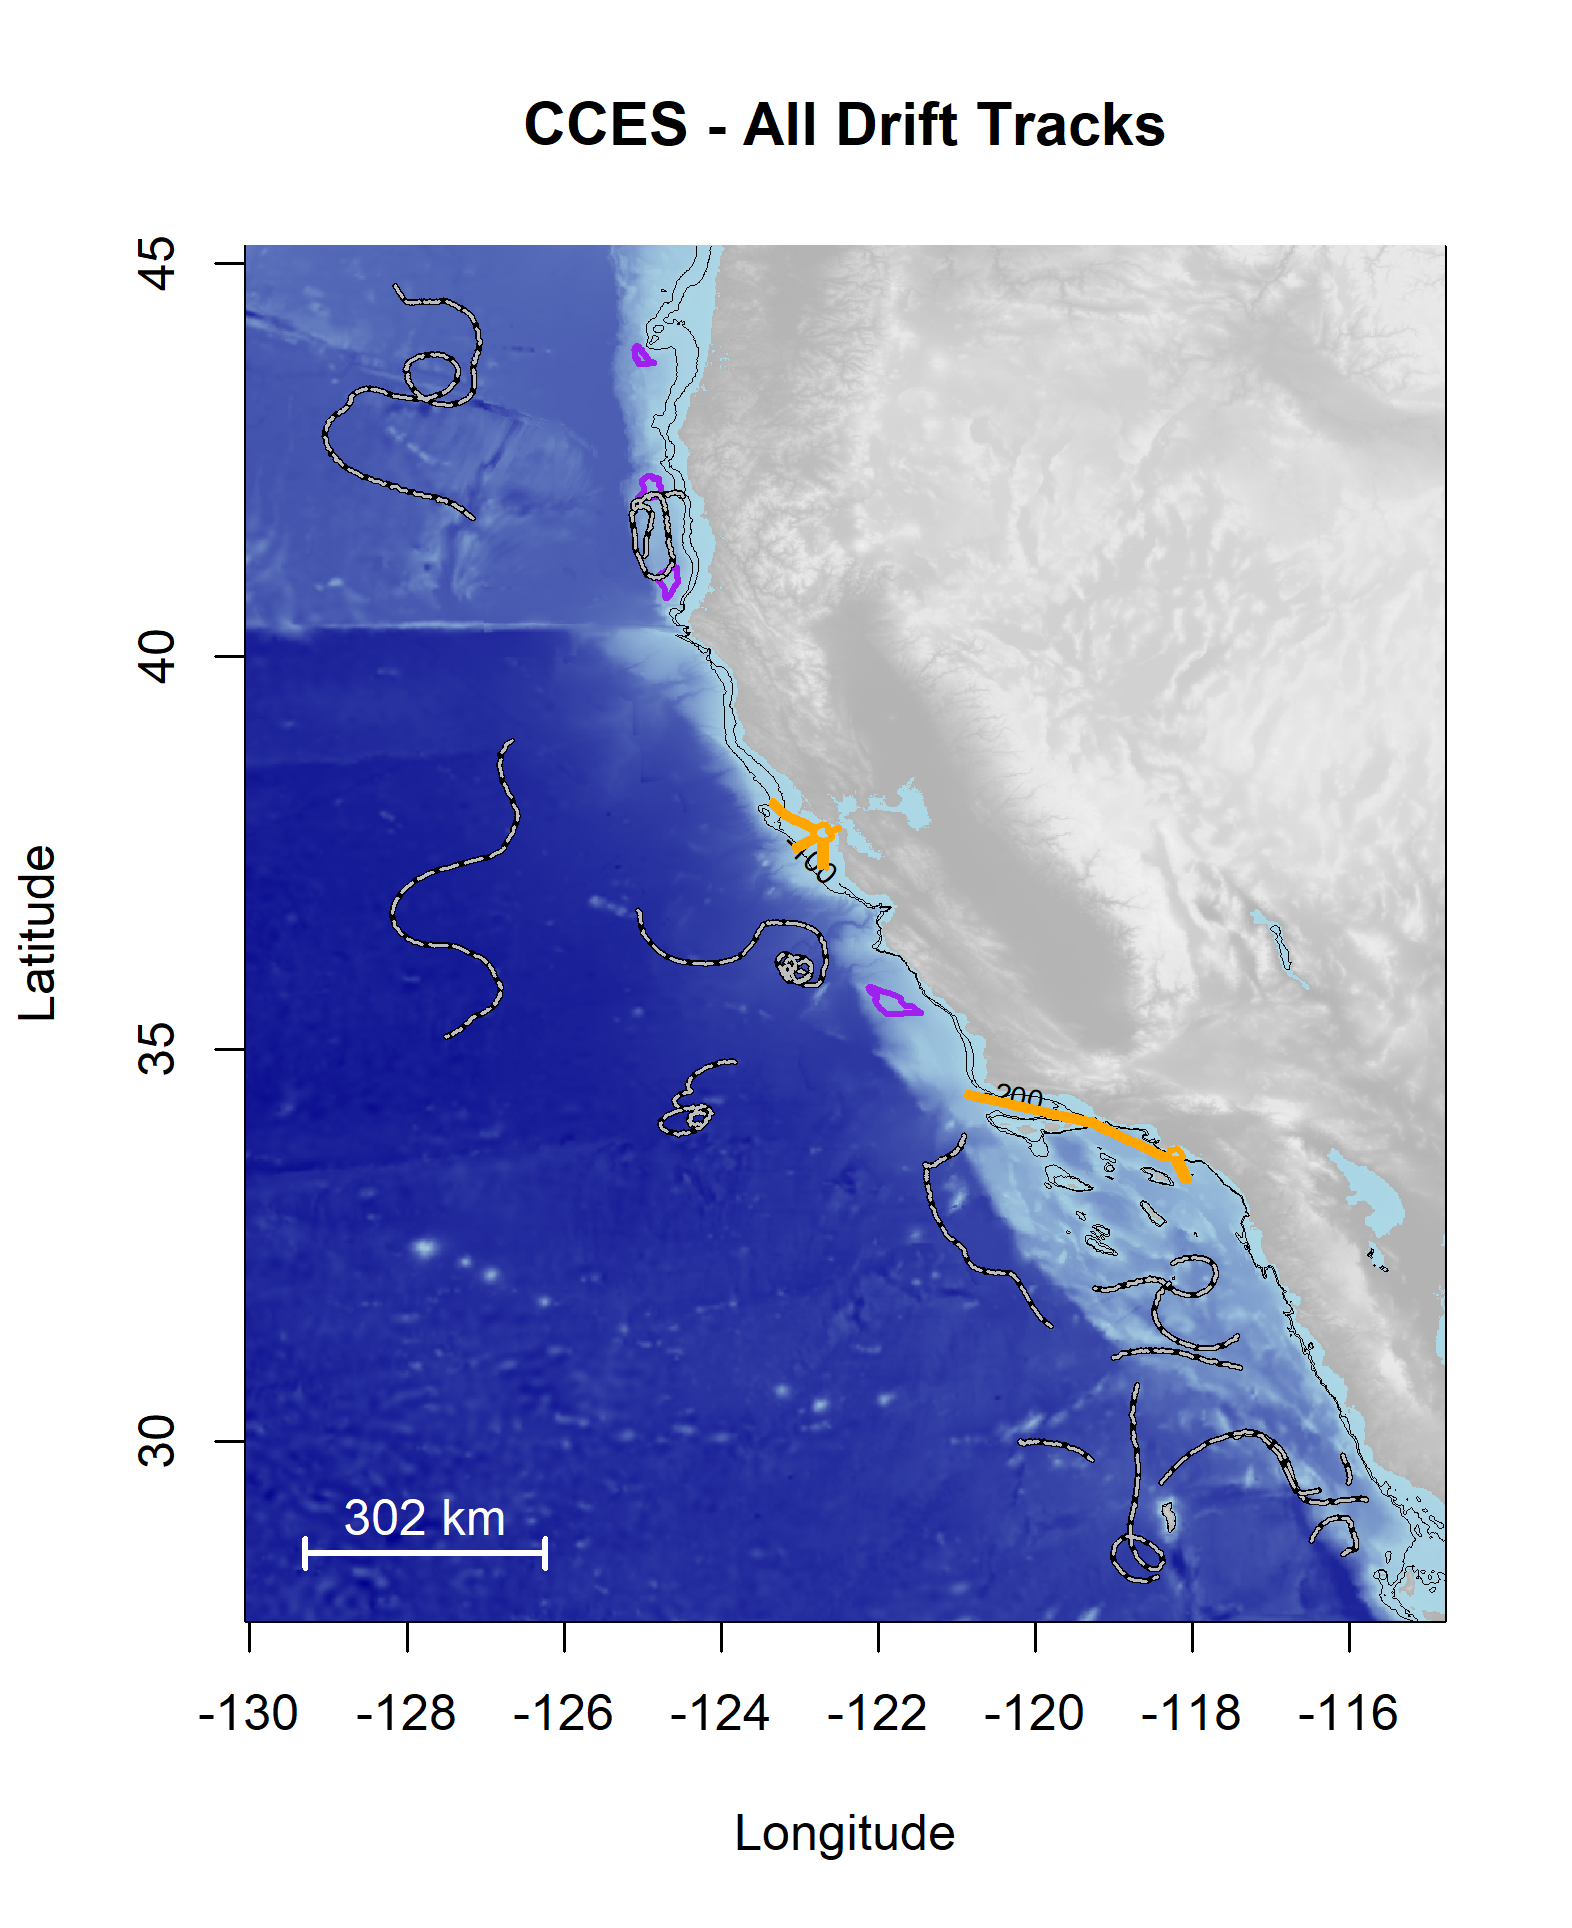
CCES was a multidisciplinary survey of the marine ecosystem from the US-Canada border south to Northern Baja California, Mexico. Background information on this survey as well as preliminary analysis of beaked whale, sperm whale, and narrow band high frequency species are provided in (Simonis 2020). A map of tracklines is provided in Figure 1.
Deployment Map
Data were analyzed following methods consistent with the Adrift data analysis, with slight modifications to address duty cycled data. The power spectral density plots (PSD) can be found online.
Odontocete Detections
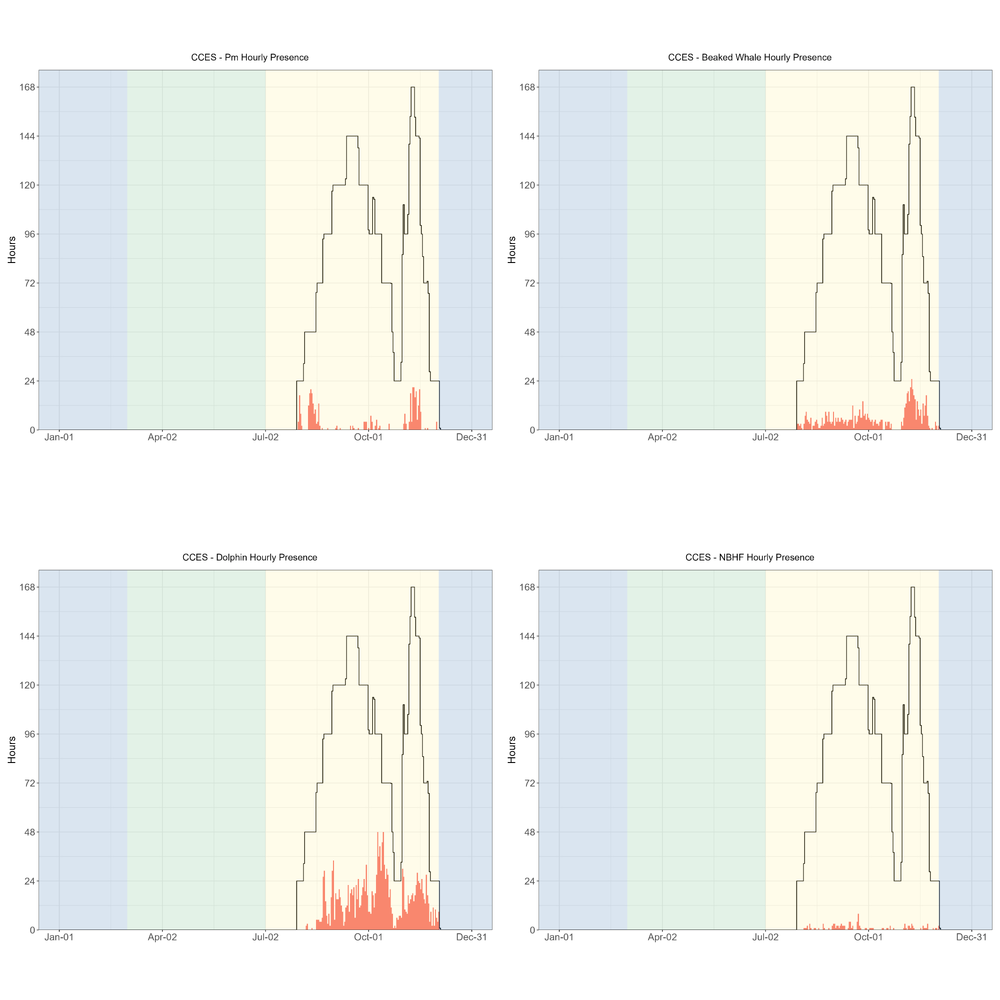
Each of the major odontocete groups were detected during the CCES study (Figure 2).
Mysticete Detections
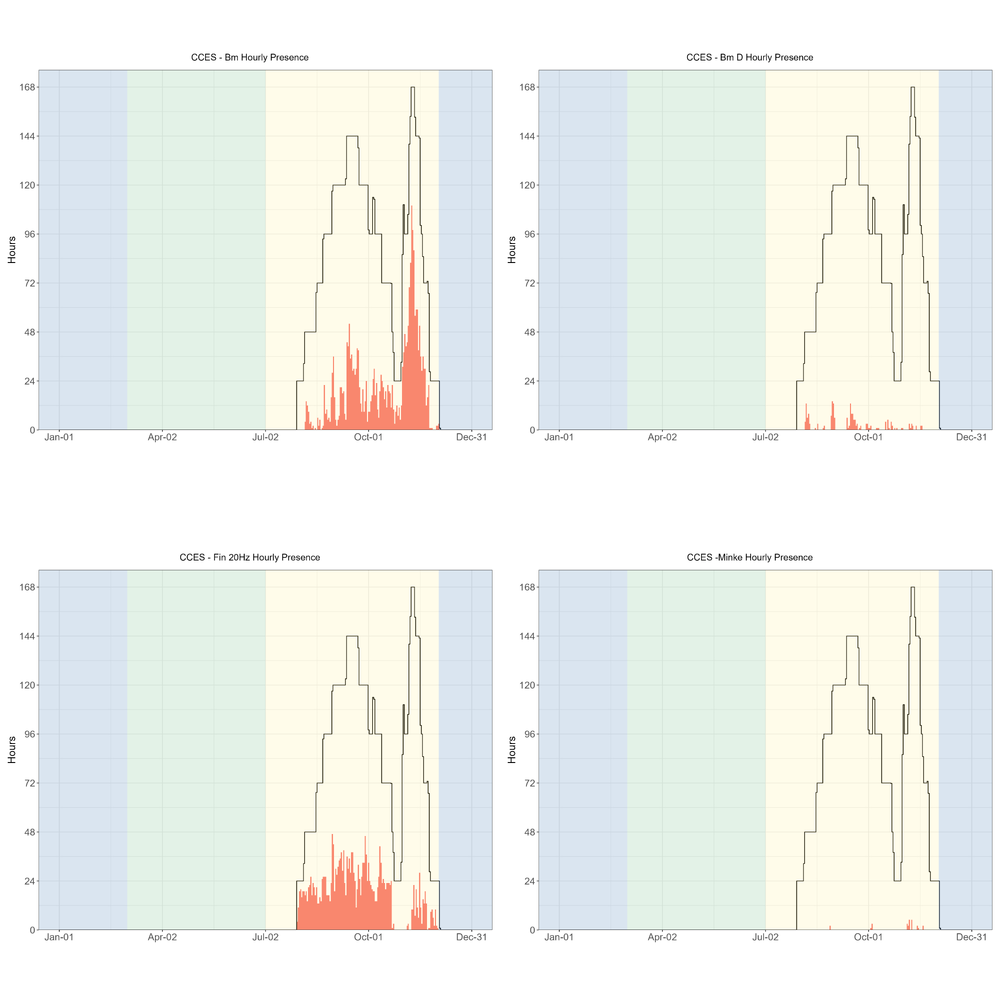
Blue whale detections were dominated by song, as the low hourly presence of D calls indicates that A/B (song) calls dominated the blue whale detections (Figure 3). There were a few minke whale detections in the later months of the survey. Detection of fin whales was dominated by 20 Hz calls (Figure 3). There were no Fin whale 40 Hz calls, or calls associated with Bryde’s, sei, or gray whales.
There were few hourly detections of humpback whales (hourly presence plots can be found in our GitHub Repository. Most of the CCES deployments were further offshore than the Adrift deployments, and this offshore distribution may be the reason for such low detection rates.
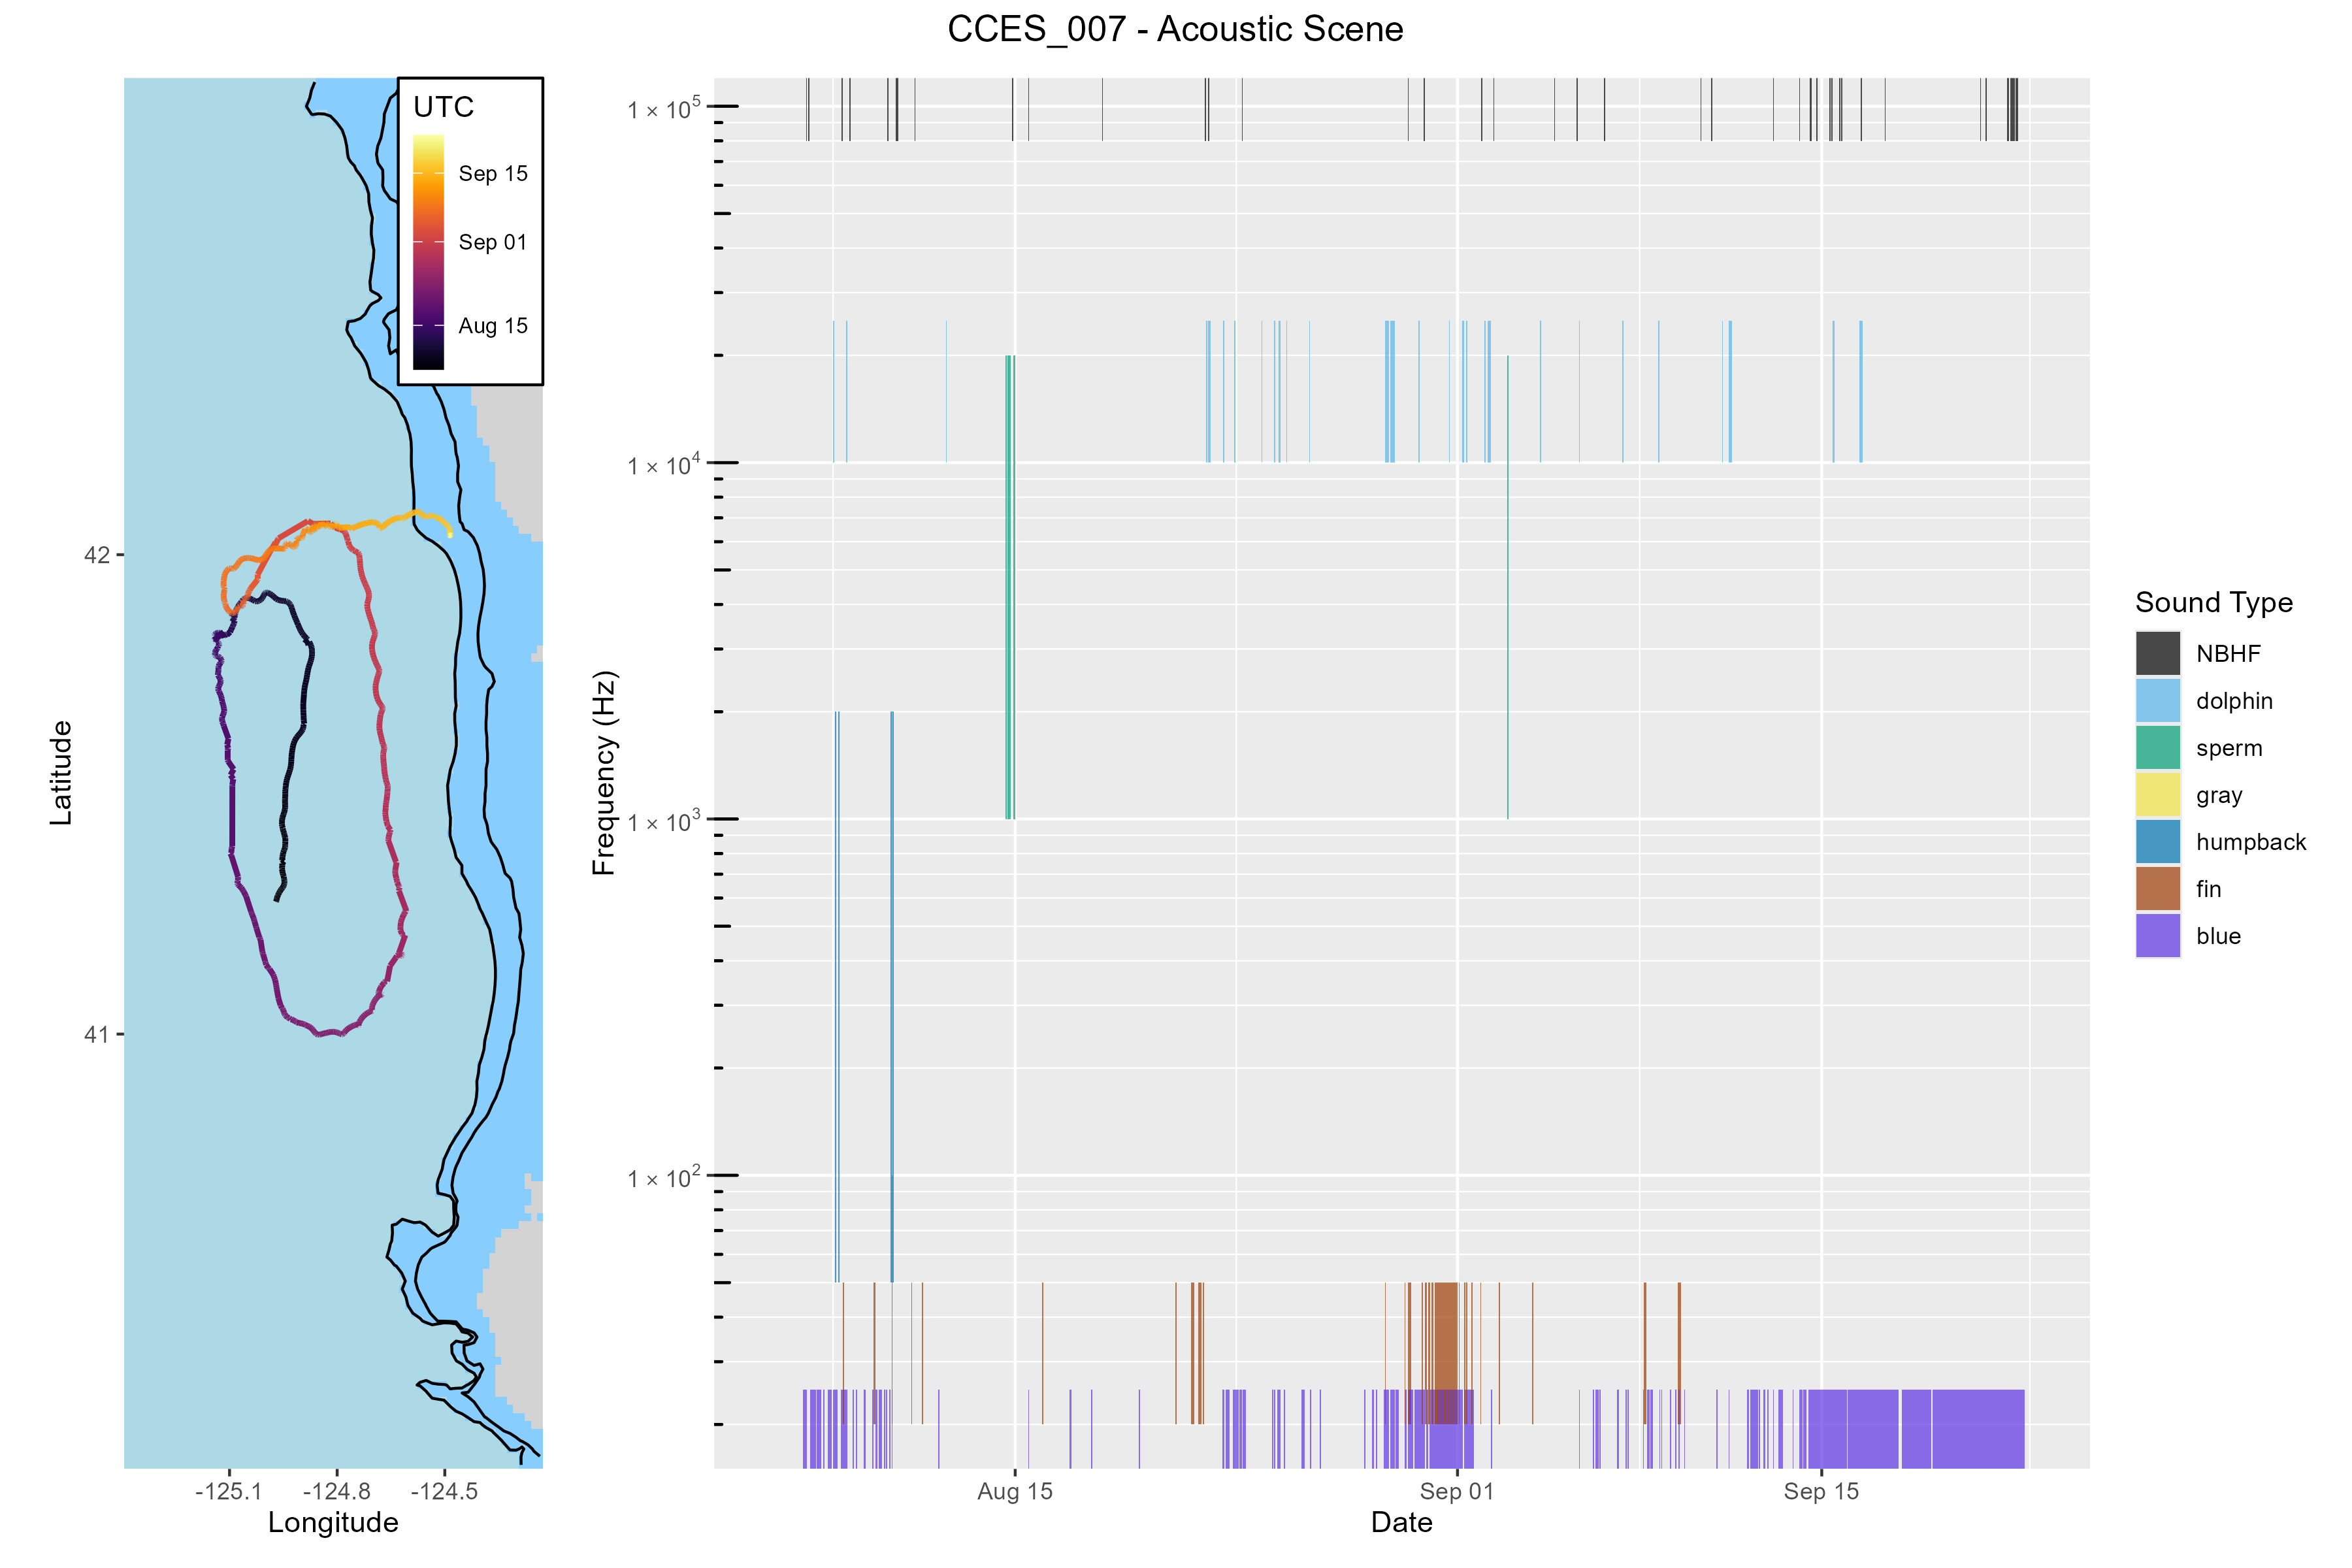
Acoustic Scenes by Drift
Temporal variation (marked in hourly bins) in the contribution of these sounds to the overall soundscape are provided by the acoustic scene. An acoustic scene provides a visualization of the spectral variation in the contributors to the soundscape, where detection of various species classes is noted by the approximate frequency of their sounds (see Figure 4). Acoustic Scenes were created for each CCES drift, and high resolution images are saved in the Adrift Github Repository, and links to specific drifts are provided in the table, below.
| CCES_004 | CCES_017 |
| CCES_007 | CCES_018 |
| CCES_008 | CCES_019 |
| CCES_010 | CCES_020 |
| CCES_012 | CCES_021 |
| CCES_013 | CCES_022 |
| CCES_014 | CCES_023 |
| CCES_016 |
CCES Deployment Table
A complete list of successful drifting recorder deployments during the CCES survey are provided in the table (below). Sites include Humboldt (HUM), Point Arena (PTA), Morro Bay (MOB), Channel Islands (CHI), and Baja California Norte (BCN). See Study Area Figure 1 for more information on regions.
References
Simonis, Anne E. 2020. “Passive Acoustic Survey of Deep-Diving Odontocetes in the California Current Ecosystem 2018: Final Report.” NOAA-TM-NMFS-SWFSC-630. https://doi.org/10.25923/W5XX-JZ73.